Fig. 12.
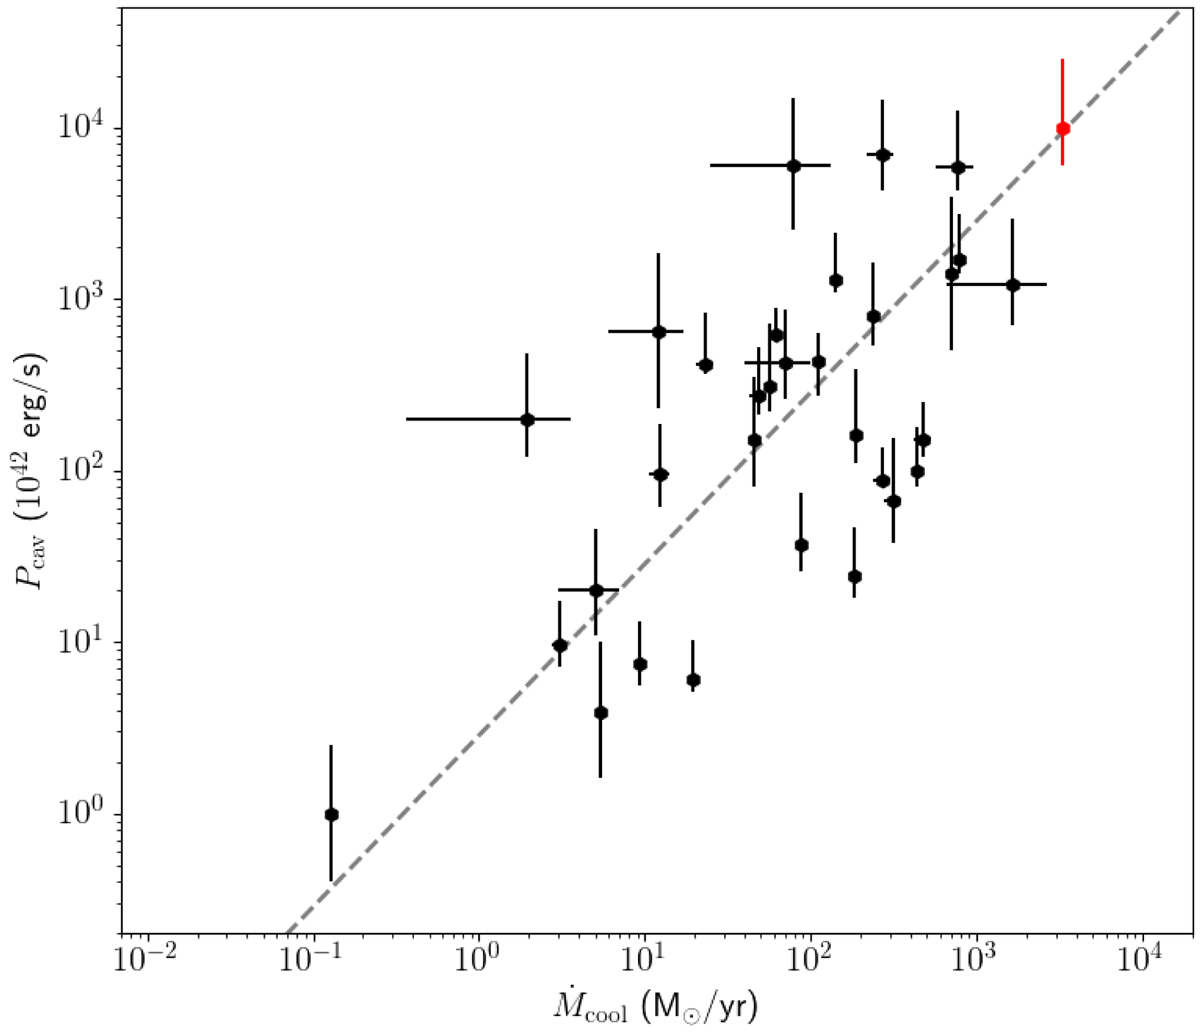
ICM cooling rate Ṁcool vs. cavity power Pcav for the sample of clusters from Rafferty et al. (2006). The red data point indicates the Phoenix cluster. The gray dashed line indicates the best power-law fit through the data and is given by log Pcav[1042 erg s−1] = (1.00 ± 0.10) log Ṁcool[M⊙/yr] + (0.45 ± 0.24). All black data points are from Rafferty et al. (2006) and McDonald et al. (2018), and the Phoenix cluster data are from McDonald et al. (2015, 2019).
Current usage metrics show cumulative count of Article Views (full-text article views including HTML views, PDF and ePub downloads, according to the available data) and Abstracts Views on Vision4Press platform.
Data correspond to usage on the plateform after 2015. The current usage metrics is available 48-96 hours after online publication and is updated daily on week days.
Initial download of the metrics may take a while.