Fig. 11.
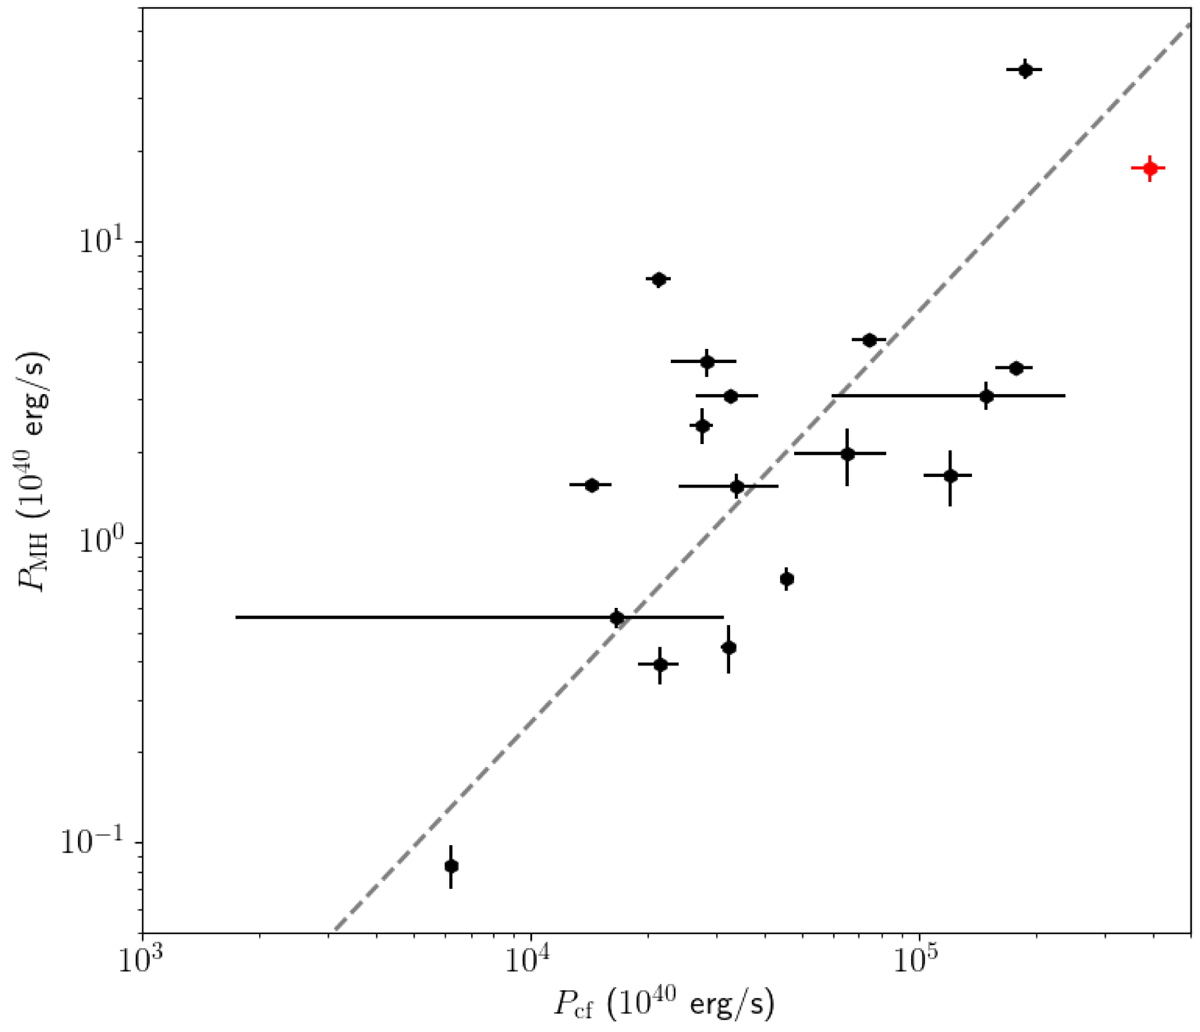
Cooling flow power versus mini-halo radio luminosity at 1.4 GHz for the sample of mini halos from Giacintucci et al. (2019). The red data point indicates the Phoenix cluster. The dashed grey line indicates the best power-law fit through the data and is given by log PMH[1040 erg s−1] = (1.37 ± 0.17)log Pcf[1040 erg s−1]−(6.07 ± 0.79). The integrated mini-halo luminosities are from Giacintucci et al. (2019) and this work. Values of the cooling rates and ICM temperatures are from Arnaud et al. (1987), Churazov et al. (2003), Gitti & Schindler (2004), Böhringer et al. (2005), Covone et al. (2006), Leccardi & Molendi (2008), Bravi et al. (2015), McDonald et al. (2015, 2018), Main et al. (2016), and Werner et al. (2016).
Current usage metrics show cumulative count of Article Views (full-text article views including HTML views, PDF and ePub downloads, according to the available data) and Abstracts Views on Vision4Press platform.
Data correspond to usage on the plateform after 2015. The current usage metrics is available 48-96 hours after online publication and is updated daily on week days.
Initial download of the metrics may take a while.