Fig. 10.
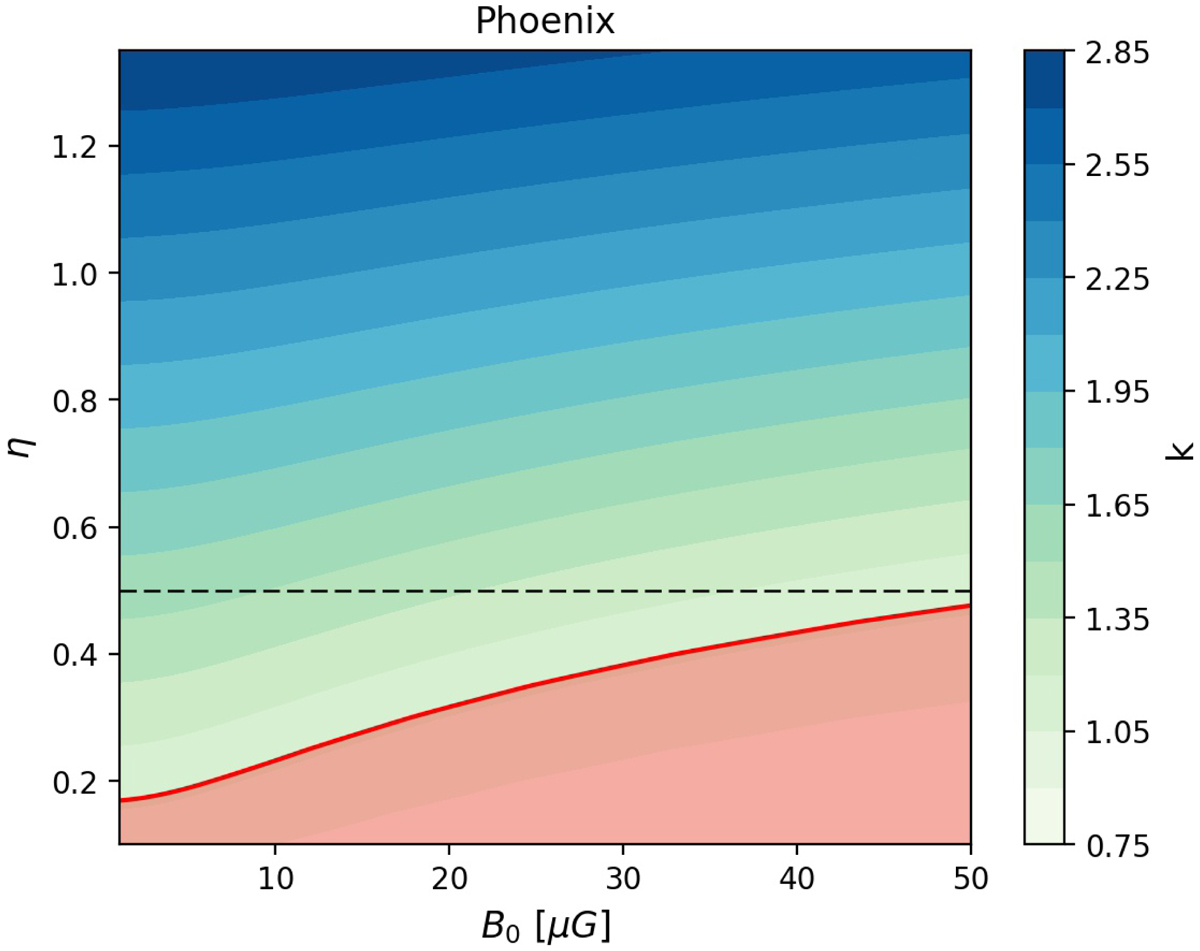
Index k for combinations of magnetic field strength and the index η. The horizontal dashed line at η = 0.5 indicates the equilibrium configuration between thermal and nonthermal energy density. The red region indicates the parameter space consistent with values of k that we obtained using the Monte Carlo point-to-point analysis.
Current usage metrics show cumulative count of Article Views (full-text article views including HTML views, PDF and ePub downloads, according to the available data) and Abstracts Views on Vision4Press platform.
Data correspond to usage on the plateform after 2015. The current usage metrics is available 48-96 hours after online publication and is updated daily on week days.
Initial download of the metrics may take a while.