Fig. 1.
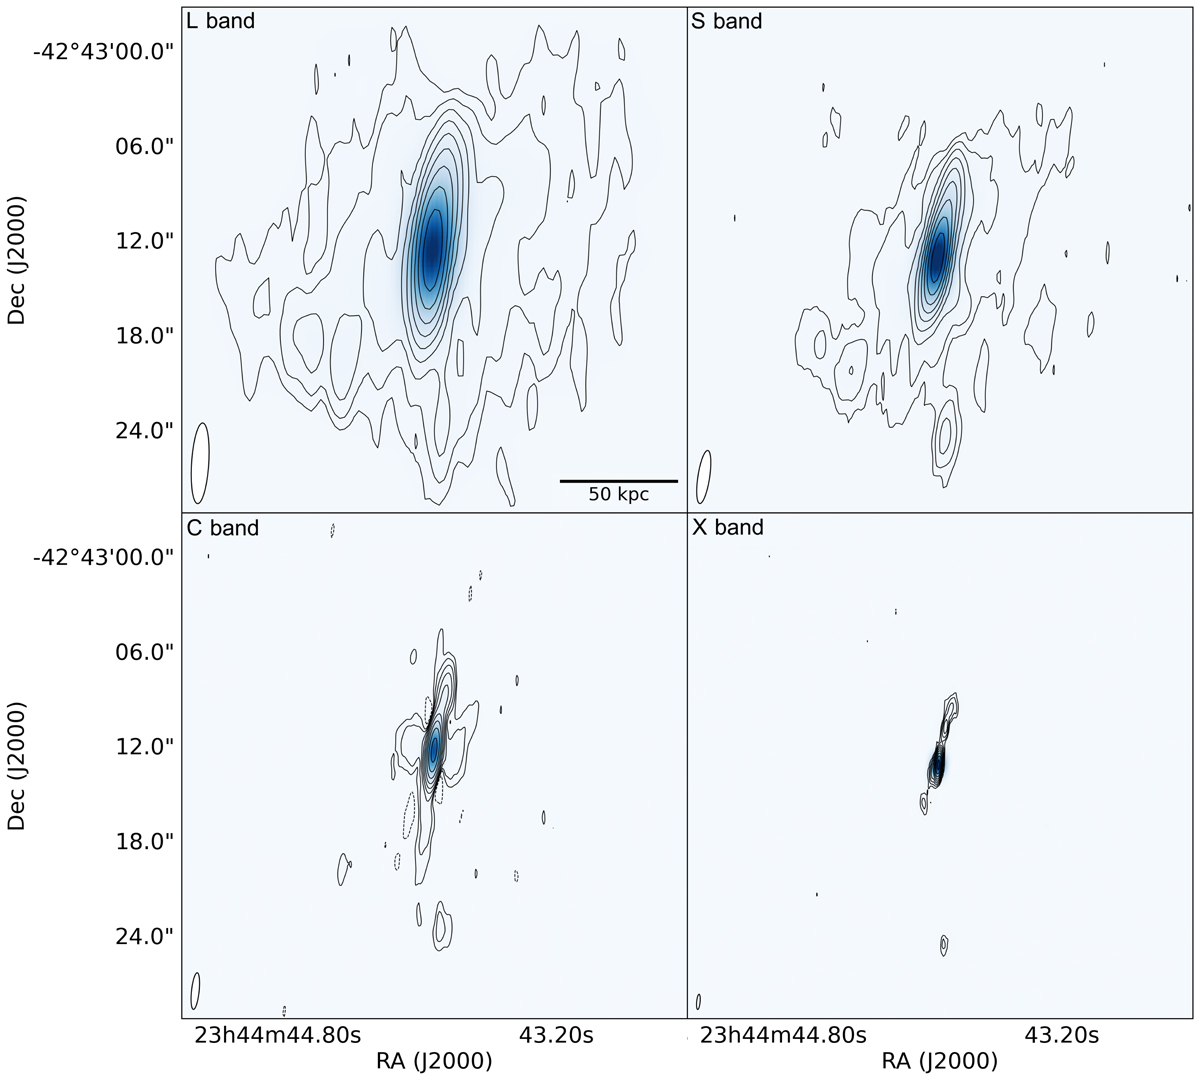
VLA images of Phoenix cluster in L band (top-left), S band (top-right), C band (bottom-left), and X band (bottom-right). Contours are drawn at [ − 1, 1, 2, 4, 8, ...] × 4σrms, where σrms = 10.8 μJy beam−1 (L band), σrms = 5.9 μJy beam−1 (S band), σrms = 4.3 μJy beam−1 (C band), and σrms = 2.2 μJy beam−1 (X band). The beam sizes are indicated in the bottom-left corners of each panel.
Current usage metrics show cumulative count of Article Views (full-text article views including HTML views, PDF and ePub downloads, according to the available data) and Abstracts Views on Vision4Press platform.
Data correspond to usage on the plateform after 2015. The current usage metrics is available 48-96 hours after online publication and is updated daily on week days.
Initial download of the metrics may take a while.