Fig. 9
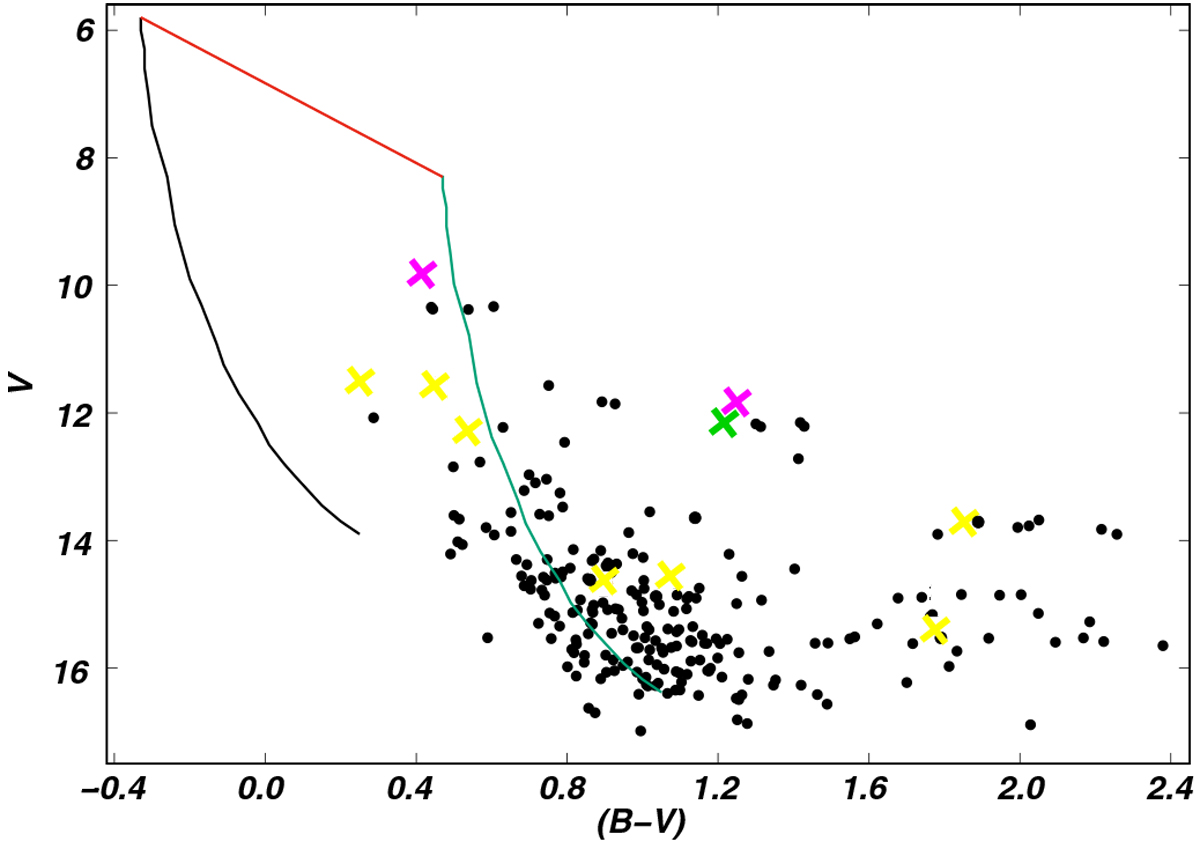
Color magnitude diagram of stars searched in a region centered in S169. Black dots are young spectral type stars with different reddening values (see text in Sect. 5). Magenta, green, and yellow crosses represent the O9V, B1V, and B2V (or later) stars, all of them ionizing candidate stars displayed with the same colors in Fig. 10. Green and black curves represent the MS shifted according to the distance modulus adopted with and without reddening, respectively. Red line indicates the normal reddening path (Rv = 3.1).
Current usage metrics show cumulative count of Article Views (full-text article views including HTML views, PDF and ePub downloads, according to the available data) and Abstracts Views on Vision4Press platform.
Data correspond to usage on the plateform after 2015. The current usage metrics is available 48-96 hours after online publication and is updated daily on week days.
Initial download of the metrics may take a while.