Fig. 7
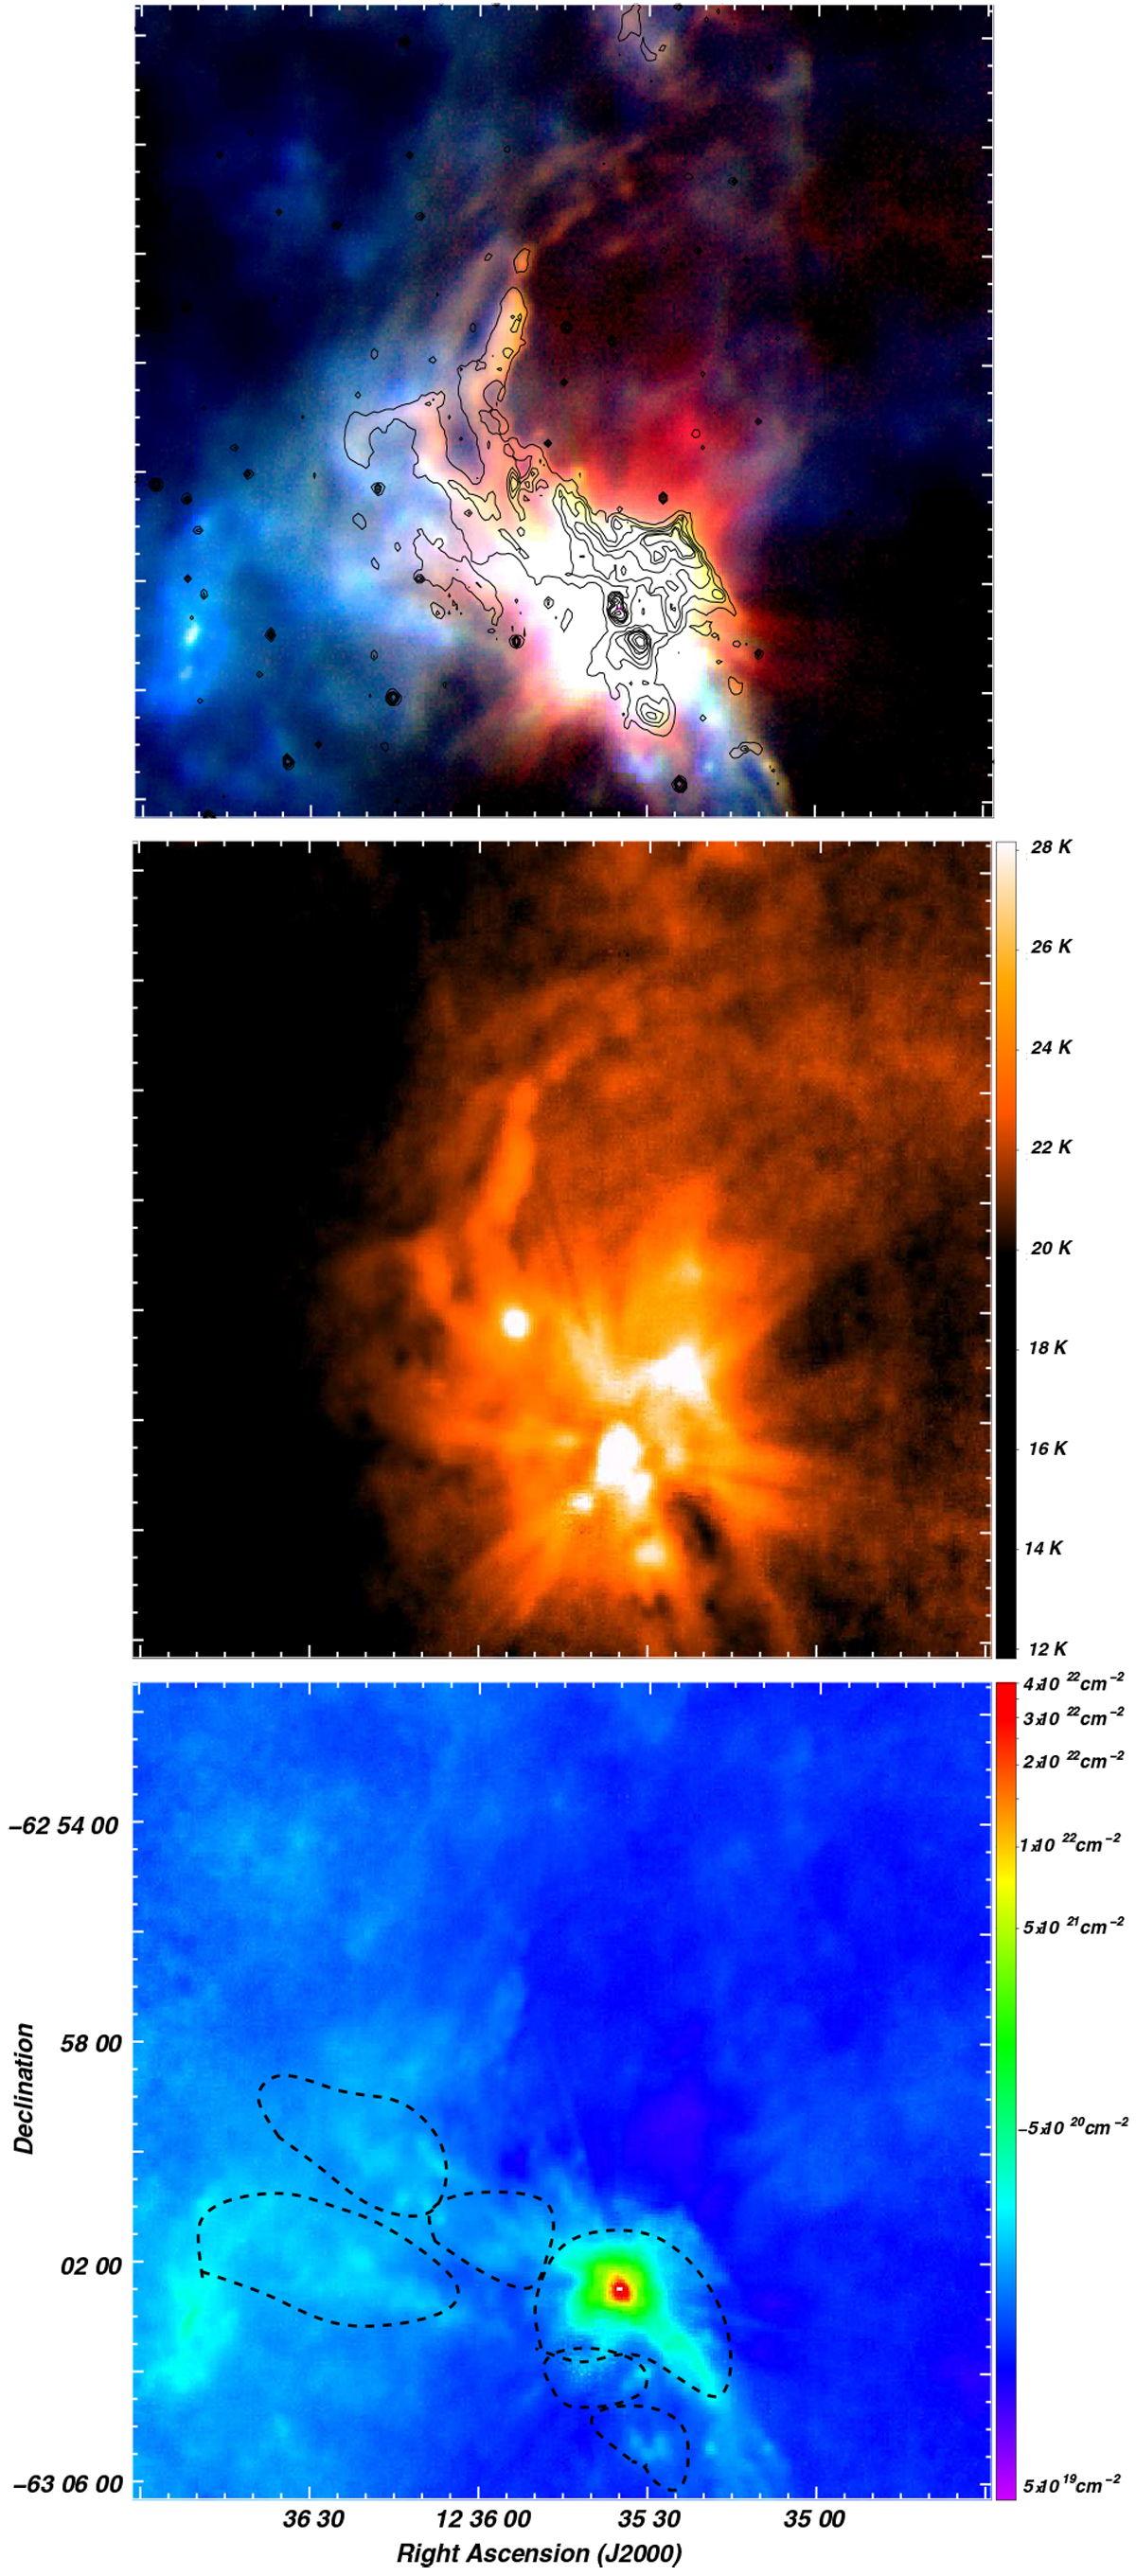
Upper panel: three-color composite image of S169: Herschel PACS 70 and 160 μm emission are in red and green, respectively. Herschel SPIRE 350 μm emission is in blue. Black contours underline de IRAC-GLIMPSE 8 μm emission at 35, 55, 75, 105, 150, 170, 300, and 500 MJy sr−1. Middle panel: dust temperature map derived from the 70 and 160 μm emission. The color temperature scale is on the right. Lower panel: column density map obtained from the 160 μm emission. Dashed black contours indicate the location of molecular concentrations MC1 to MC6 for orientation.
Current usage metrics show cumulative count of Article Views (full-text article views including HTML views, PDF and ePub downloads, according to the available data) and Abstracts Views on Vision4Press platform.
Data correspond to usage on the plateform after 2015. The current usage metrics is available 48-96 hours after online publication and is updated daily on week days.
Initial download of the metrics may take a while.