Fig. 6
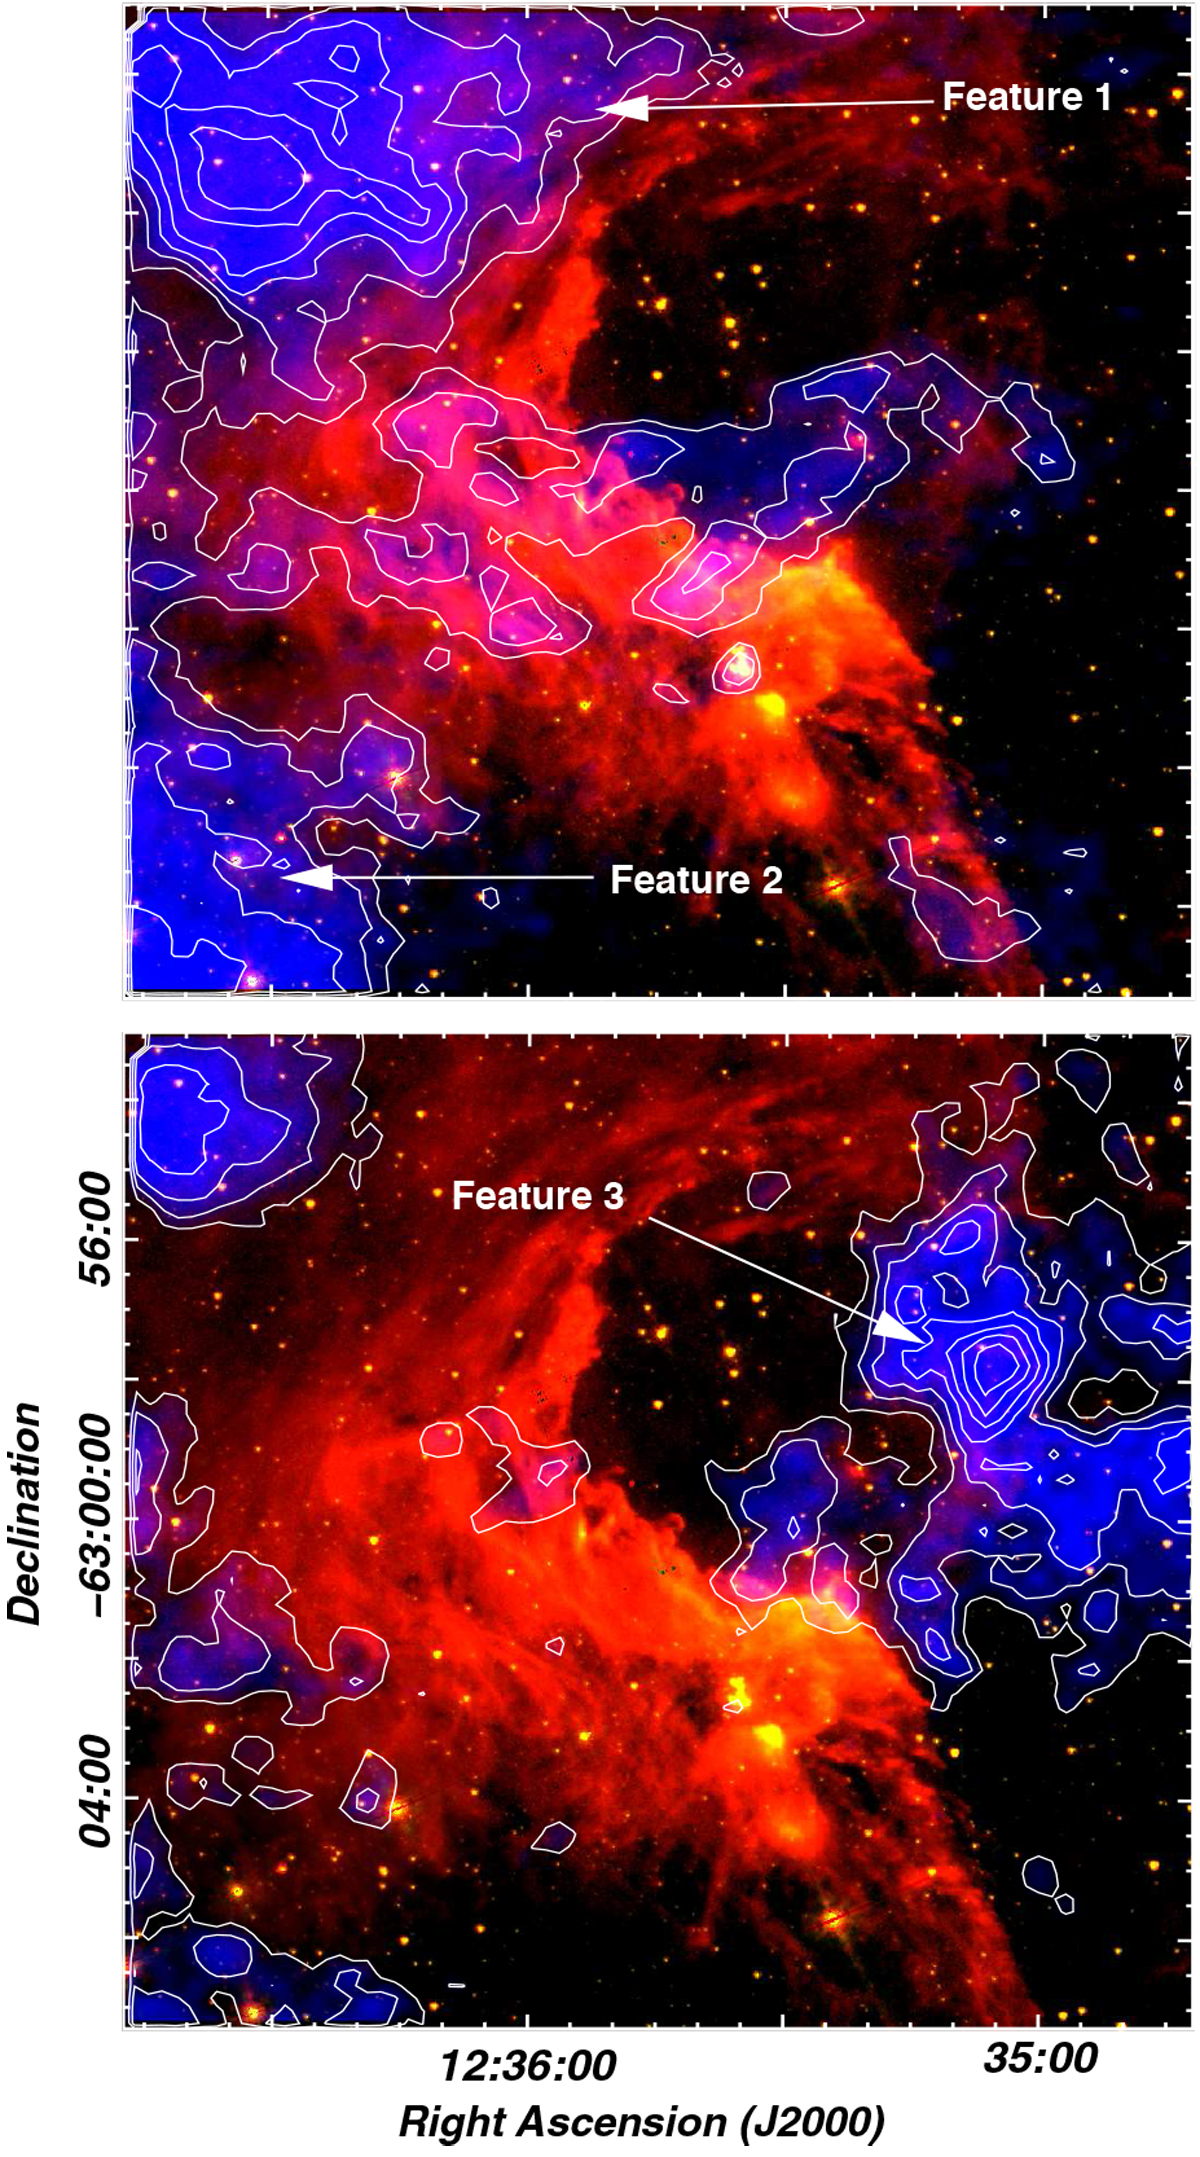
Upper panel: spatial distribution of the CO emission (blue color scale and white contours) in the velocity interval from −28.9 km s−1 to −18.9 km s−1 (component B) superimposed on the IRAC 8 μm and 5.8 μm emissions (red and green color scales). The contour levels start from 0.95 K km s−1 (~9 rms) in stepsof 0.5 K km s−1. Lower panel: spatial distribution of the CO emission in the velocity interval from −18.2 to −12.7 km s−1 (component C). The contour levels start from 0.85 K km s−1 (~7 rms) in stepsof 0.4 K km s−1.
Current usage metrics show cumulative count of Article Views (full-text article views including HTML views, PDF and ePub downloads, according to the available data) and Abstracts Views on Vision4Press platform.
Data correspond to usage on the plateform after 2015. The current usage metrics is available 48-96 hours after online publication and is updated daily on week days.
Initial download of the metrics may take a while.