Fig. 5
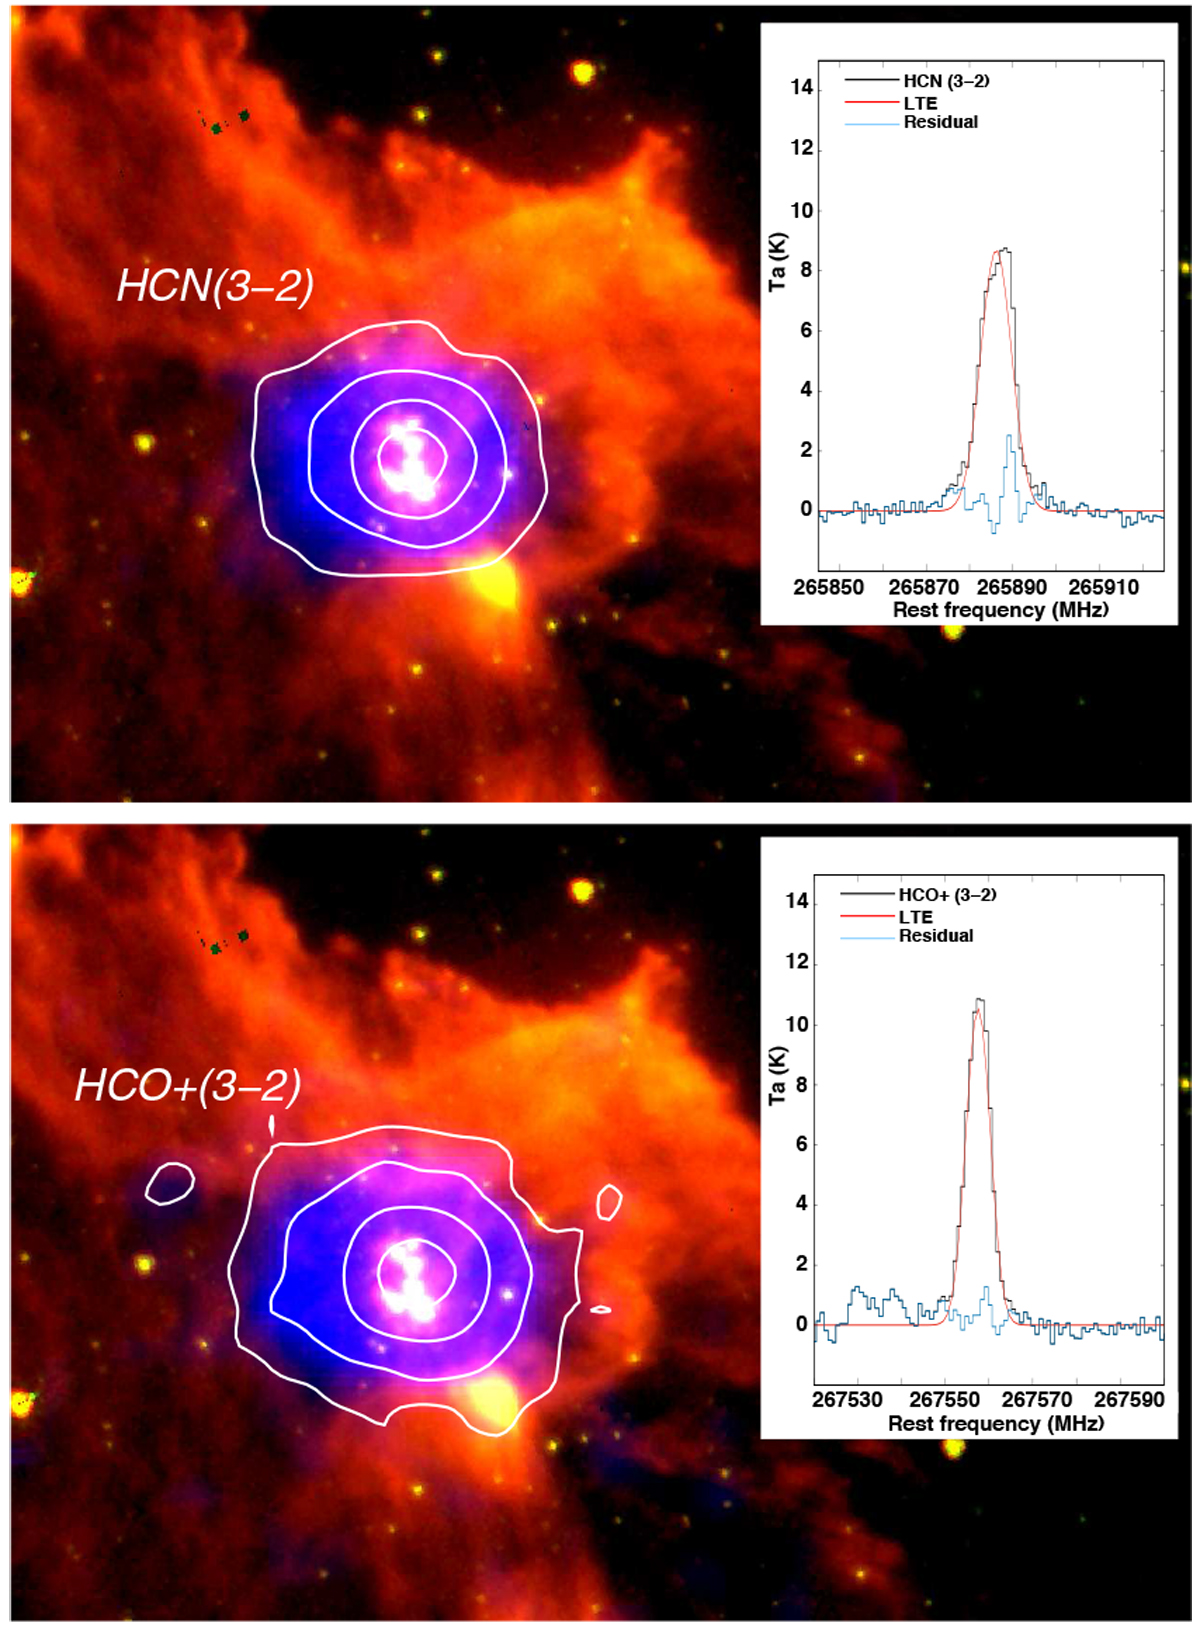
Upper panel: spectral line and LTE model of the HCN (3–2) line obtained from LTE-MCMC calculations assuming Texc = 150 K (see text), with a resulting density of N = (1.9 ± 0.5) × 1014 cm−2. The blue line indicates the residual obtained from the subtraction between the observation and LTE model. In colors: spatial distribution of the HCN (3–2) emission in the velocity interval from −47.6 to −29.2 km s−1 (color blue and white contours) superimposed on the IRAC 8 and 5.8 μm emissions (red and green colors). Lower panel: same as above for the HCO+ (3–2) line, assuming Texc = 50 K, with a resulting density of N = (5.2 ± 0.1) × 1013 cm−2. The HCO+ (3–2) emission distribution is in the velocity interval from −44.8 to −32.5 km s−1. The contour levels for the HCN (3–2) are 0.25 (~5 rms), 0.85, 2.2, and 4.0 K km s−1; and for the HCO+ (3–2) line, they are 0.28(~5 rms), 0.8, 2.4, and 5 K km s−1
Current usage metrics show cumulative count of Article Views (full-text article views including HTML views, PDF and ePub downloads, according to the available data) and Abstracts Views on Vision4Press platform.
Data correspond to usage on the plateform after 2015. The current usage metrics is available 48-96 hours after online publication and is updated daily on week days.
Initial download of the metrics may take a while.