Fig. 4
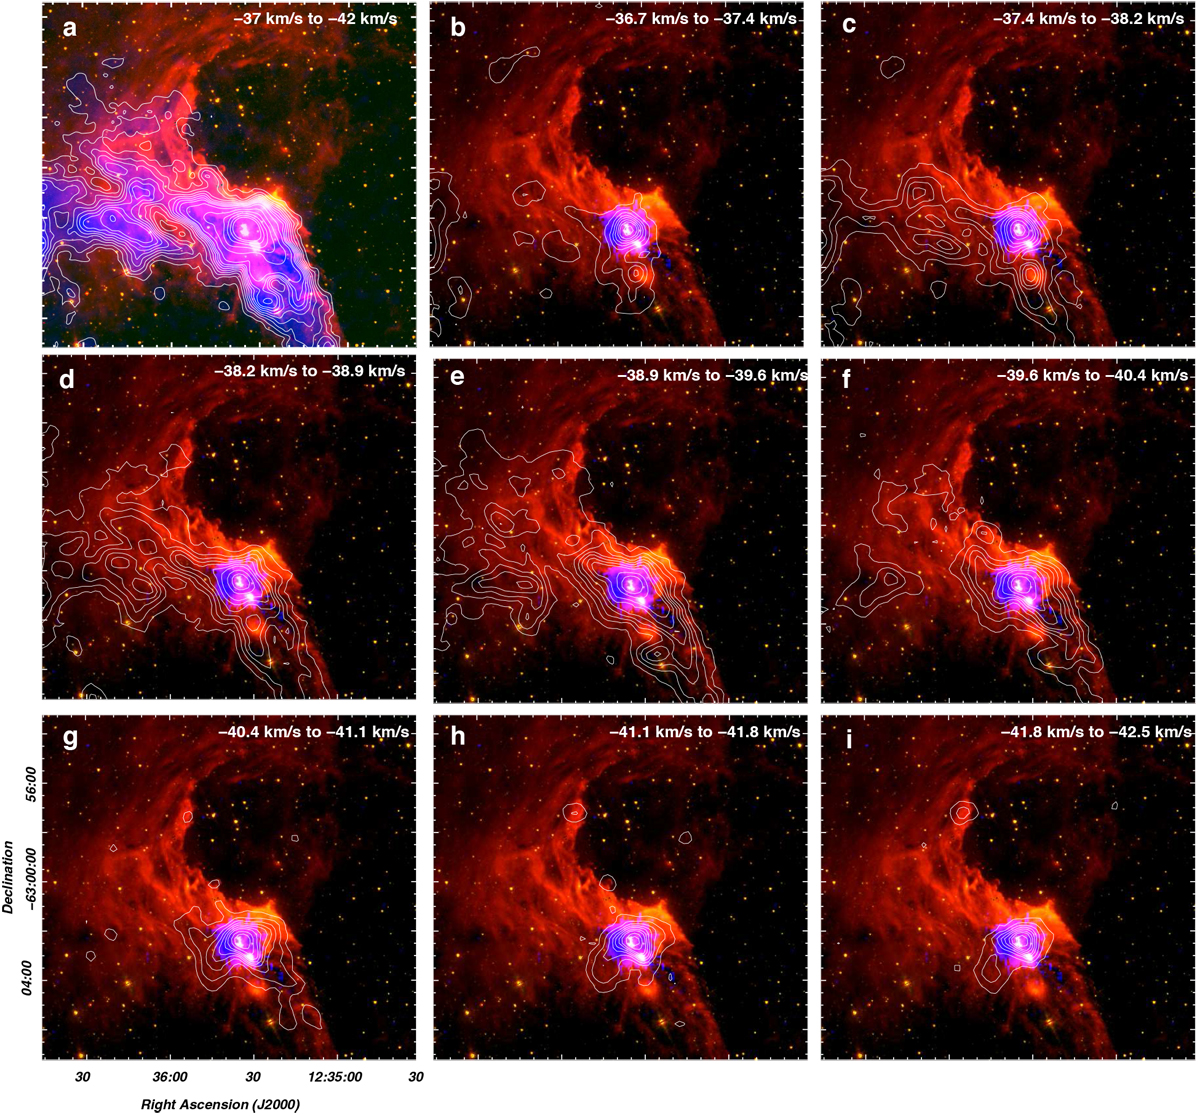
Panel a: emission distribution of the 13CO(2–1) line in the total velocity range from –37 to –42 km s−1 (white contours and blue color scale) superimposed on the IRAC-GLIMPSE images at 8.0 and 5.8 μm (red and green color scales, respectively). The contours levels are the same than those shown in the middle panel of Fig. 3. Panels b to i: channel maps of the 13 CO (2–1) line emission in velocity intervals of 0.7 km s−1 (white contours) in the velocity range from –36.7 to –42.5 km s−1 superimposed on the 8.0 and 5.8 μm (IRAC-GLIMPSE) emissions (red and green color scales) and 870 μm ATLASGAL emission (blue color scale) inside the 3 rms limit. Contours levels are 0.9 (~5.5 rms), 2.6, 4.4, 6.2, 7.9, 10, 12, 16, and 20 K km s−1. The velocityinterval is indicated in the top right corner of each panel.
Current usage metrics show cumulative count of Article Views (full-text article views including HTML views, PDF and ePub downloads, according to the available data) and Abstracts Views on Vision4Press platform.
Data correspond to usage on the plateform after 2015. The current usage metrics is available 48-96 hours after online publication and is updated daily on week days.
Initial download of the metrics may take a while.