Free Access
Fig. 12
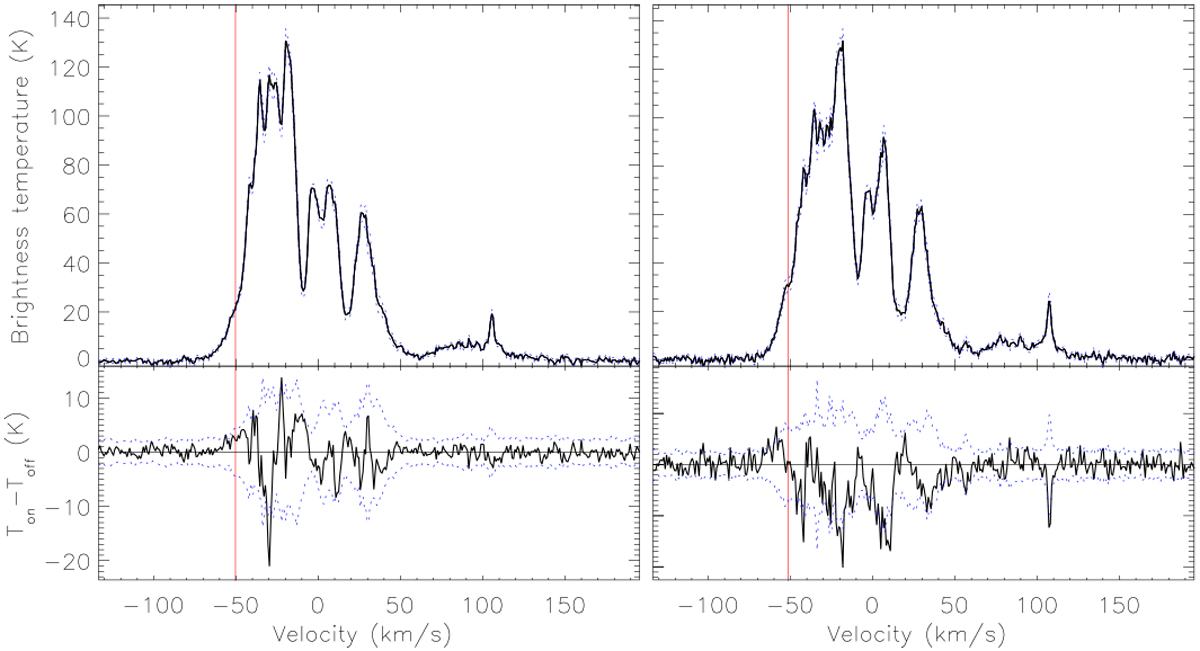
Left panel: HI emission/absorption profile towards the bright southern component of the radio continuum arc-shaped feature. Right panel: same for the extragalactic source at the north of the nebula. The error envelopes are plotted withblue dotted lines. Vertical red lines indicate the velocity of the tangent point.
Current usage metrics show cumulative count of Article Views (full-text article views including HTML views, PDF and ePub downloads, according to the available data) and Abstracts Views on Vision4Press platform.
Data correspond to usage on the plateform after 2015. The current usage metrics is available 48-96 hours after online publication and is updated daily on week days.
Initial download of the metrics may take a while.