Fig. 7
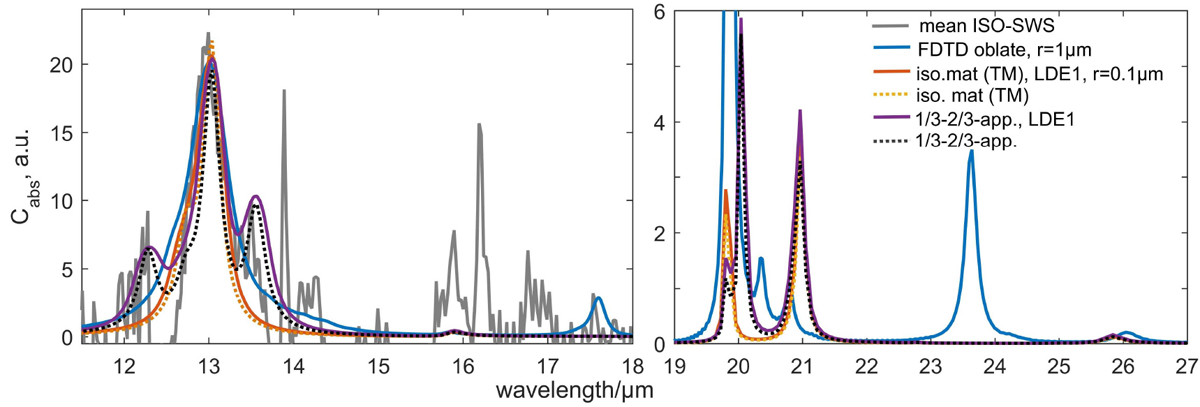
Comparison of spectra calculated by the T-matrix formalism for oblate spheroidal particles of equivalent sphere radius 0.1 μmm (except blue line: r = 1μm) with the mean of 23 ISO-SWS spectra (grey line). Purple line: weighted sum of orientation-averaged spectra of spheroids of hypothetic isotropic materials, calculated for a limited distribution (LDE1) of axis ratios (1:1.25–1:1.58). Black dotted line: same, but for a sole axis ratio 1:1.4. Red line: average of the three spectra (two of them identical) with the c-axis parallel to the particle symmetry axis for the LDE1 axis ratio distribution. Yellow line: same for the sole axis ratio 1:1.4. Blue line: single FDTD spectrum of an oblate corundum particle with r = 1μm and ratio of 1:1.4.
Current usage metrics show cumulative count of Article Views (full-text article views including HTML views, PDF and ePub downloads, according to the available data) and Abstracts Views on Vision4Press platform.
Data correspond to usage on the plateform after 2015. The current usage metrics is available 48-96 hours after online publication and is updated daily on week days.
Initial download of the metrics may take a while.