Fig. 6
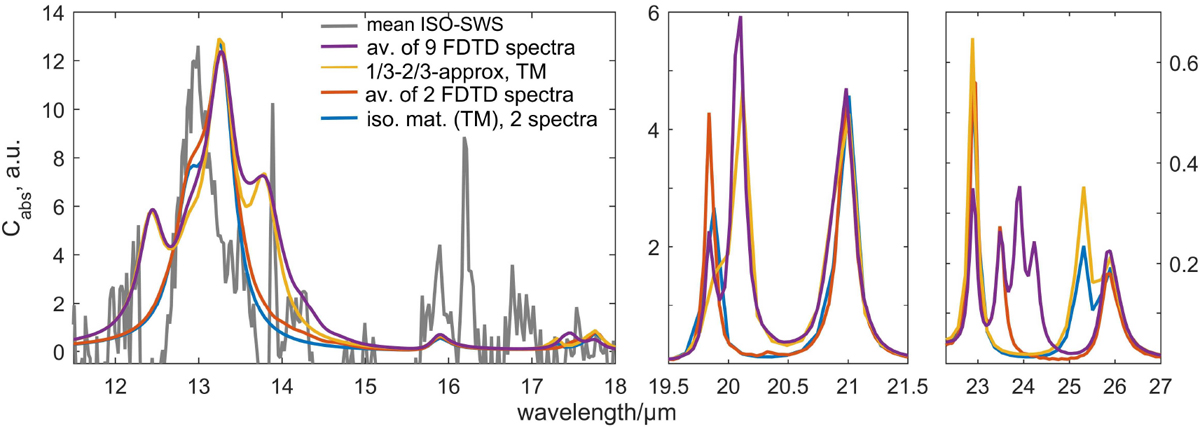
Comparison of spectra calculated by T-matrix formalism (blue and yellow) and FDTD (red and purple) for spheroidal particles with axis ratio 1:1.4 and radius r = 0.75μm, showing spectral features due to material anisotropy. Grey line: mean of 23 measured ISO-SWS spectra. Purple line: average of nine FDTD spectra of the start- and endposition of each setup. Yellow line: 1/3–2/3-approximation of orientation-averaged spectra for two isotropic materials. Red line: average of the FDTD spectra (two of the three spectra are identical) calculated for the c-axis oriented parallel to the particle rotation axis. Blue line: the same for TM spectra
Current usage metrics show cumulative count of Article Views (full-text article views including HTML views, PDF and ePub downloads, according to the available data) and Abstracts Views on Vision4Press platform.
Data correspond to usage on the plateform after 2015. The current usage metrics is available 48-96 hours after online publication and is updated daily on week days.
Initial download of the metrics may take a while.