Fig. 5
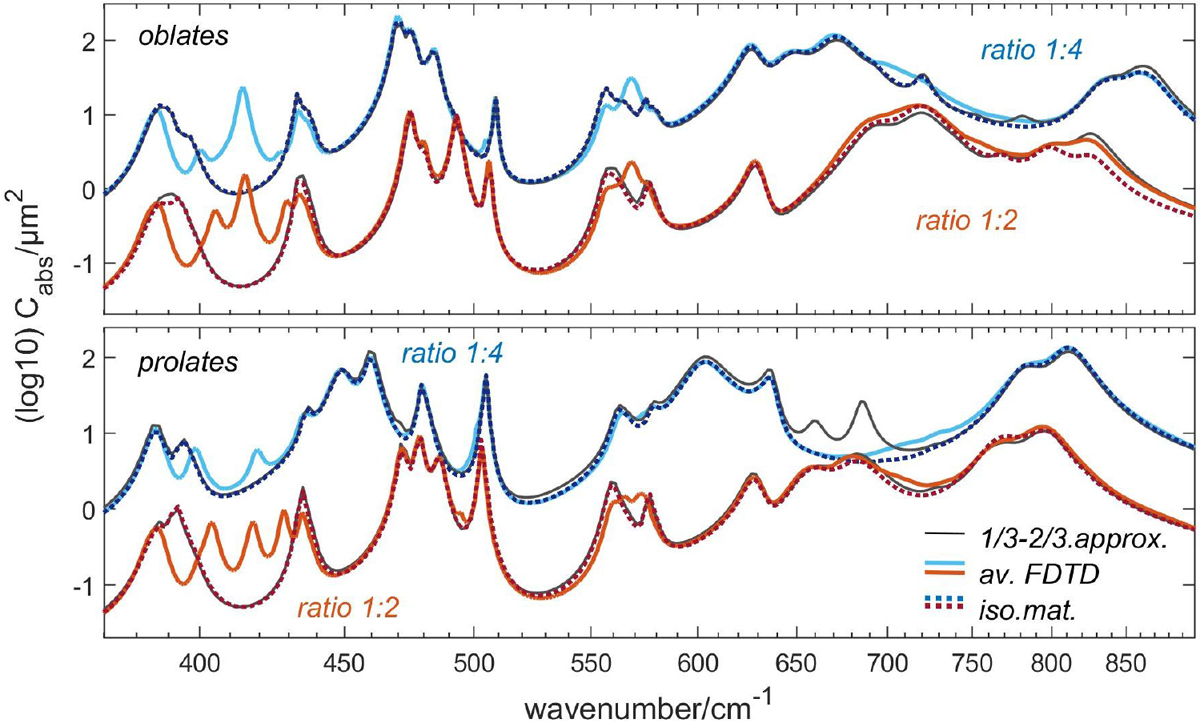
Orientation-averaged spectra of oblate (upper panel) and prolate (lower panel) spheroidal particles with different axis ratios and equivalent sphere radius 1 μm. Solid lines: average of the 9 relevant FDTD spectra of the start- and endposition of each setup. Dotted lines: average of the according spectra of the isotropic materials. Thin grey lines: 1/3–2/3-approximation of the orientation-averaged spectra calculated with the T-matrix implementation of Somerville et al. (2016). For moderate axis ratios, the average of the nine spectra is a convenient alternative for an orientation-averaged spectrum. Thanks to this, the effects of the material anisotropy can be identified in the averaged FDTD spectra.
Current usage metrics show cumulative count of Article Views (full-text article views including HTML views, PDF and ePub downloads, according to the available data) and Abstracts Views on Vision4Press platform.
Data correspond to usage on the plateform after 2015. The current usage metrics is available 48-96 hours after online publication and is updated daily on week days.
Initial download of the metrics may take a while.