Fig. 2
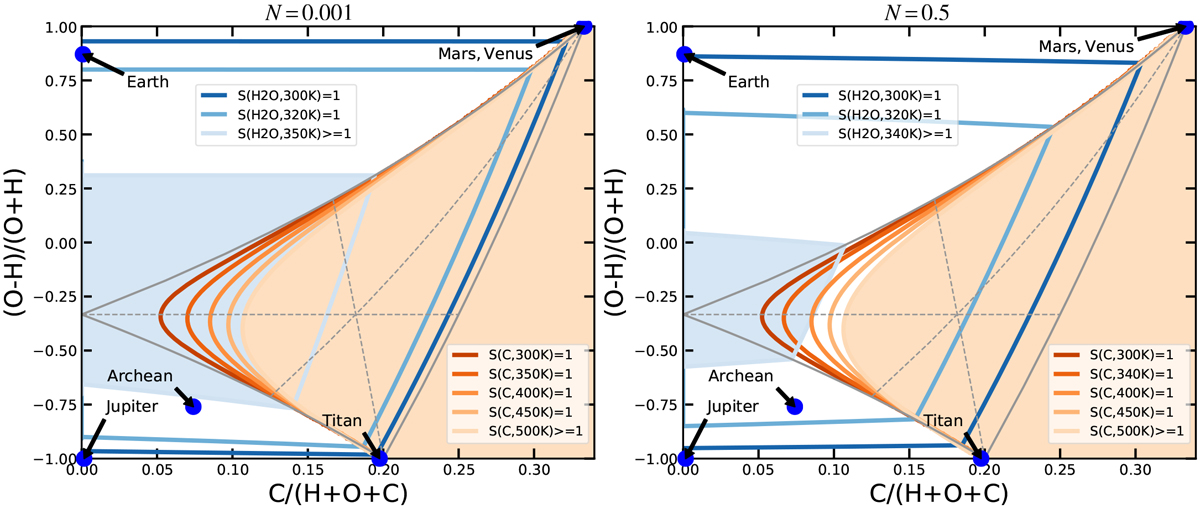
Impact of liquid water (H2O) and graphite(C) condensation at constant pressure of 1 bar. The blue and orange contour lines mark where the supersaturation ratio S is equal to one for water and graphite, respectively, at selected temperatures. Inside of the light blue and light orange shaded regions, the gas is supersaturated with respect to water at 350 K and graphite at 500 K, respectively. For higher temperatures, lower pressures or higher N abundances, the shaded areas shrink and eventually vanish. The left diagram is calculated for a small nitrogen abundance N = 0.001, whereas N = 0.5 is assumed in the right diagram. The atmospheric compositions of Earth, Mars, Venus, Jupiter, Titan, and the Archean Earth (taken from Miller 1953) are marked. Earth (assuming 1.5% water content) sits right on top of the S(H2 O, 300 K, N = 0.5) = 1 line.
Current usage metrics show cumulative count of Article Views (full-text article views including HTML views, PDF and ePub downloads, according to the available data) and Abstracts Views on Vision4Press platform.
Data correspond to usage on the plateform after 2015. The current usage metrics is available 48-96 hours after online publication and is updated daily on week days.
Initial download of the metrics may take a while.