Fig. 1
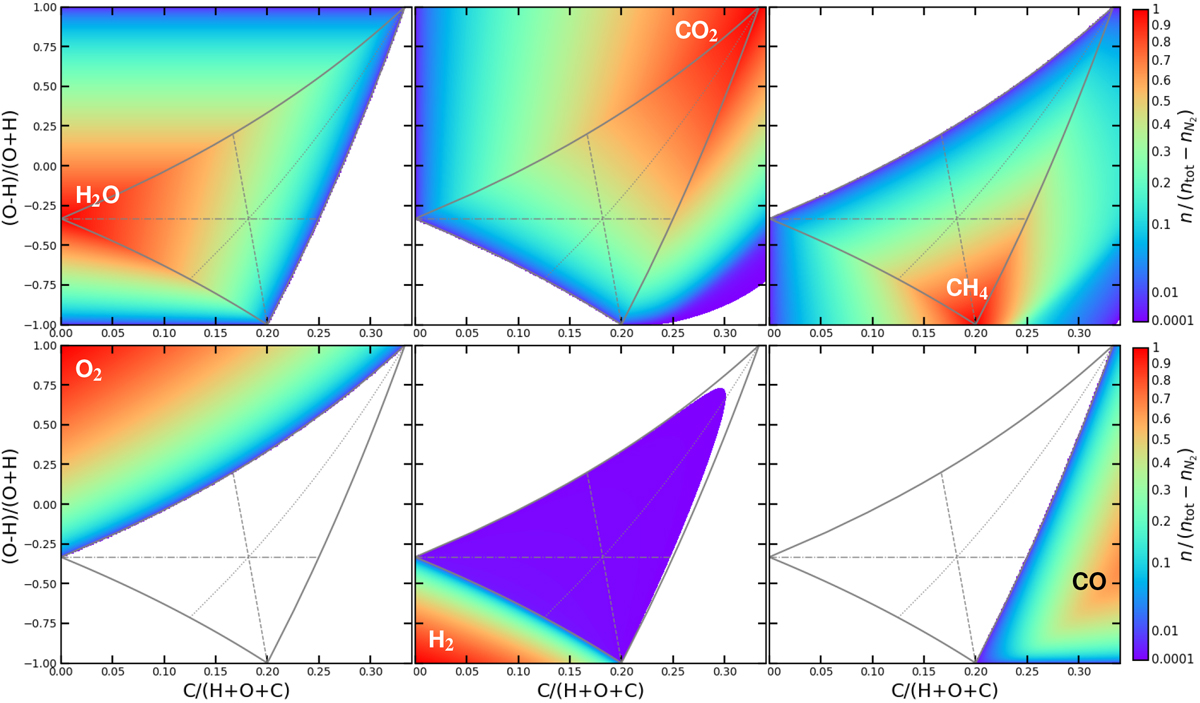
Molecular concentrations in chemical equilibrium as a function of H, C, and O element abundances, calculated for T = 400 K and p = 1 bar. The central grey triangle marks the region within which H2O, CH4, and CO2 coexist in chemical equilibrium. The thin grey lines indicate where two concentrations are equal: ![]() (dashed),
(dashed), ![]() (dash-dotted), and
(dash-dotted), and ![]() (dotted). n means particle densities. Blank regions have concentrations <10−4. In order to enhance the colour contrasts, a colour-map was chosen that is linear in
(dotted). n means particle densities. Blank regions have concentrations <10−4. In order to enhance the colour contrasts, a colour-map was chosen that is linear in ![]() from 0.01 to1.
from 0.01 to1.
Current usage metrics show cumulative count of Article Views (full-text article views including HTML views, PDF and ePub downloads, according to the available data) and Abstracts Views on Vision4Press platform.
Data correspond to usage on the plateform after 2015. The current usage metrics is available 48-96 hours after online publication and is updated daily on week days.
Initial download of the metrics may take a while.