Fig. 9
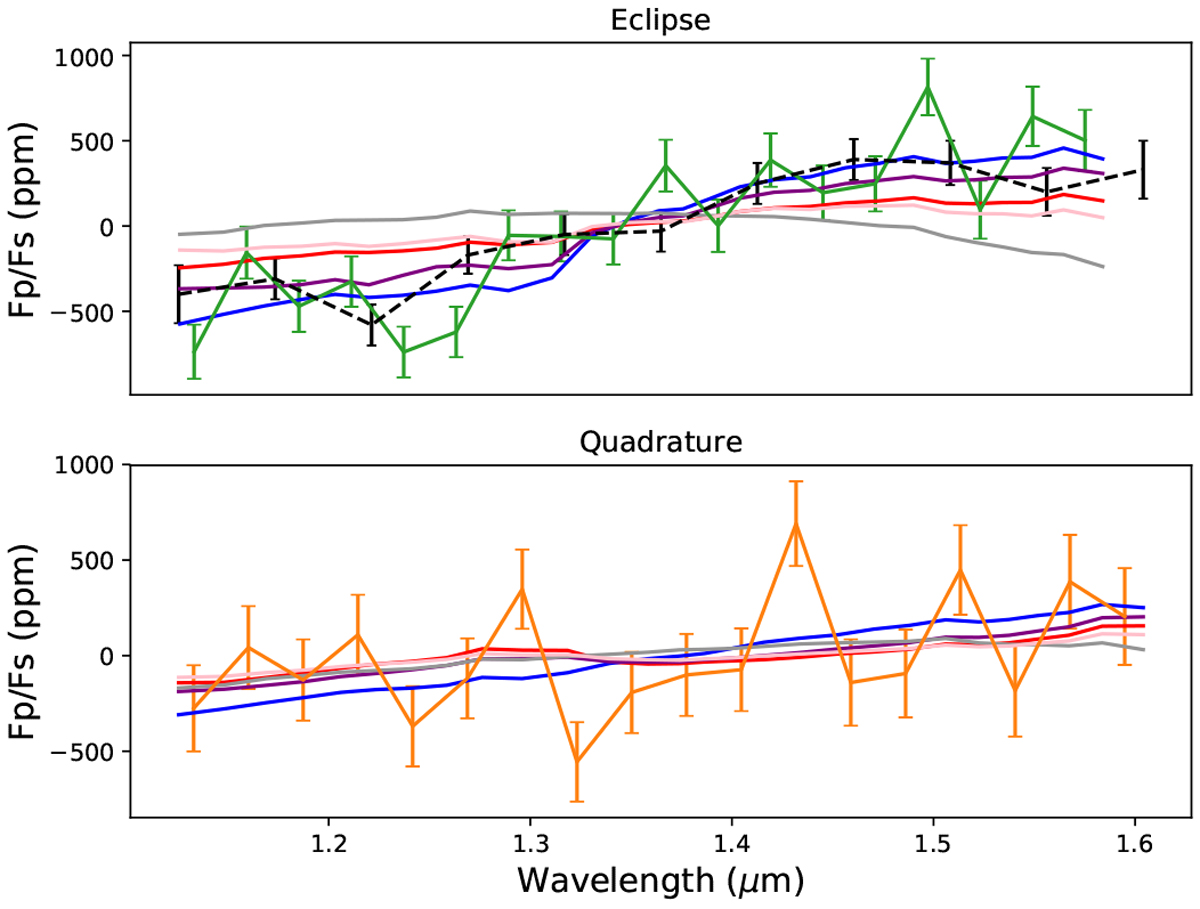
Comparison of extracted exoplanet spectra to GCM results. All measured spectra and models are normalised by the average of the spectrum across the bandpass in order to allow a comparison to our relative spectra. Top: data for the eclipse (in green) as well as the dayside spectrum extracted by Stevenson et al. (2014, in dashed black). Bottom: extracted quadrature spectrum (in orange). For both panels the models are shown for solar composition (red), no-dissociation (blue), no H- (purple), no molecular opacity (grey), and factor-two higher optical opacity (pink).
Current usage metrics show cumulative count of Article Views (full-text article views including HTML views, PDF and ePub downloads, according to the available data) and Abstracts Views on Vision4Press platform.
Data correspond to usage on the plateform after 2015. The current usage metrics is available 48-96 hours after online publication and is updated daily on week days.
Initial download of the metrics may take a while.