Fig. 7
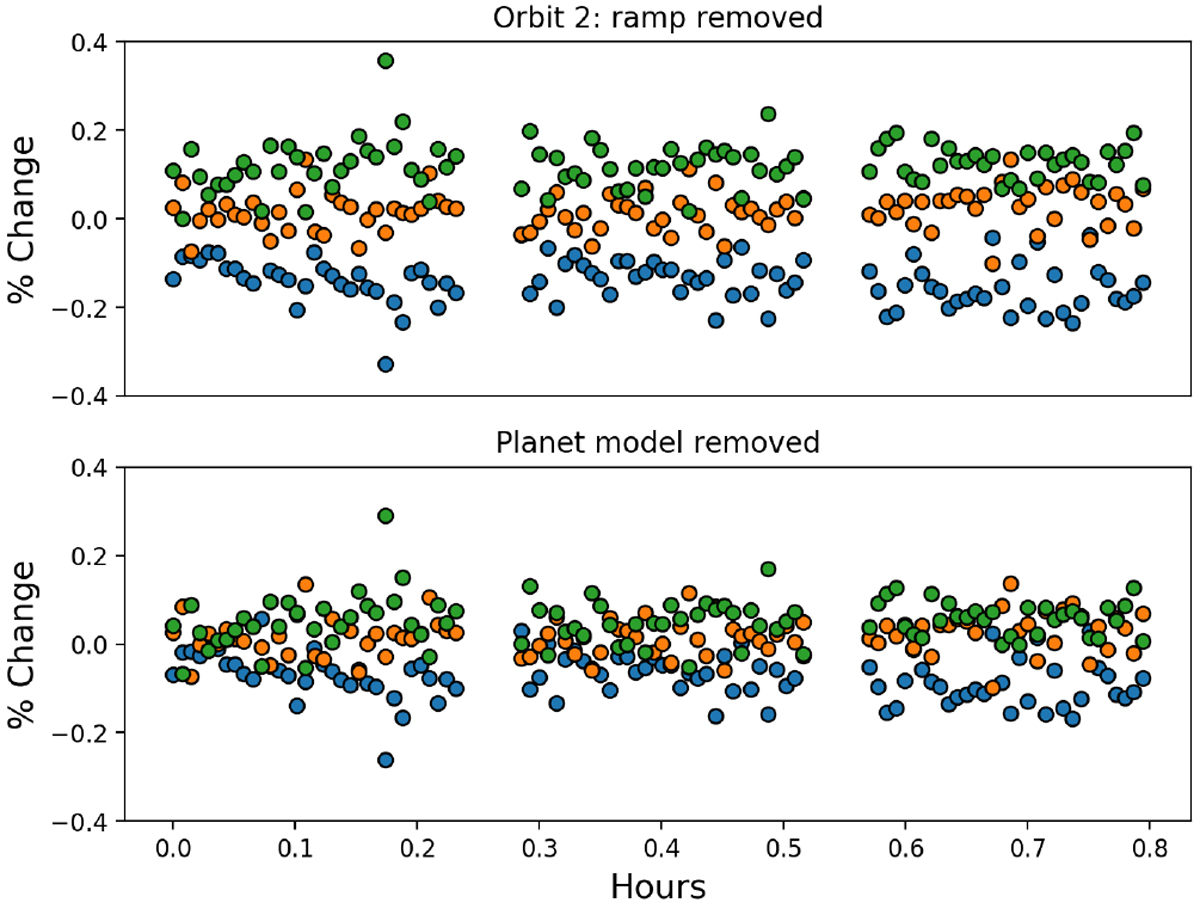
Brightness of exposures taken during the second orbit of each visit, coloured by the corresponding visit and measured relative to an average across all three visits, discussed further in Sect. 2.7. Green points are from the transit visit,orange from the quadrature visit, and blue from the eclipse visit. The exposures are plotted in hours from the beginning of the orbit. Top: exposures from the second orbits as a percentage change from the average second orbit across all visits. Bottom: same exposures with the predicted planetary contribution removed.
Current usage metrics show cumulative count of Article Views (full-text article views including HTML views, PDF and ePub downloads, according to the available data) and Abstracts Views on Vision4Press platform.
Data correspond to usage on the plateform after 2015. The current usage metrics is available 48-96 hours after online publication and is updated daily on week days.
Initial download of the metrics may take a while.