Fig. 6
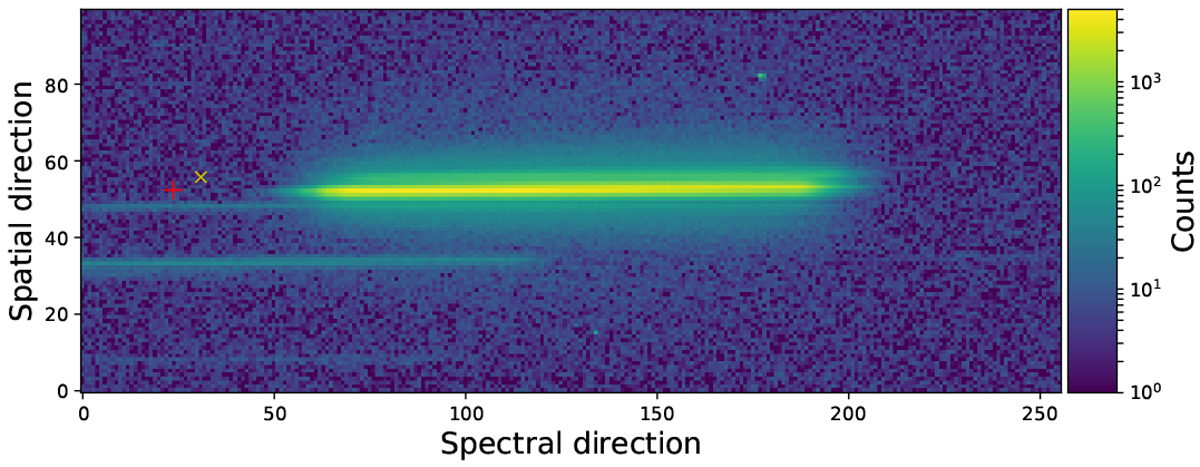
Cutout 2D image of a single representative exposure. The bright spectrum in the centre is that of WASP-12A, and directly superimposed is the combined spectrum of WASP-12BC, seen as the faint trace above the main trace. Below these two are spectra of faint background stars. The locations where the non-dispersed direct images would fall are marked as crosses, red for WASP-12A and yellow for WASP-12BC.
Current usage metrics show cumulative count of Article Views (full-text article views including HTML views, PDF and ePub downloads, according to the available data) and Abstracts Views on Vision4Press platform.
Data correspond to usage on the plateform after 2015. The current usage metrics is available 48-96 hours after online publication and is updated daily on week days.
Initial download of the metrics may take a while.