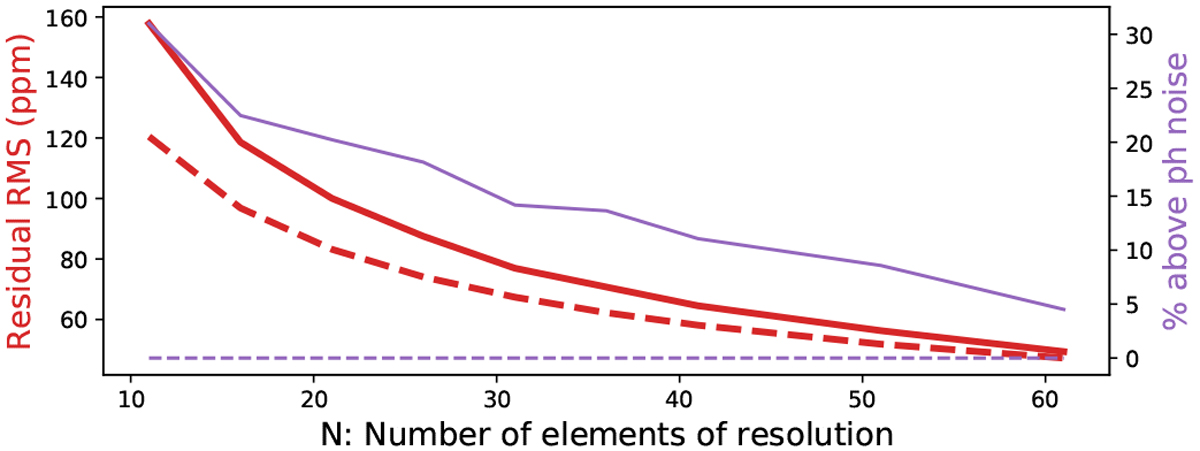
Fig. 5

Measured scatter of the residuals of the light curve taken from the in-eclipse orbit and normalised by the white-light curve for various sizes of wavelength bin (decreasing number of wavelength bins towards the right). The scatter represents the average rms of the residuals from the light curve across the wavelength bins for each choice of binning. The left y-axis shows the residual rms, plotted as the thick red lines, while the right y-axis shows the scatter as a percentage of the photon noise limit, plotted as the thin purple lines. Dotted lines show the expected photon noise limit in each case.
Current usage metrics show cumulative count of Article Views (full-text article views including HTML views, PDF and ePub downloads, according to the available data) and Abstracts Views on Vision4Press platform.
Data correspond to usage on the plateform after 2015. The current usage metrics is available 48-96 hours after online publication and is updated daily on week days.
Initial download of the metrics may take a while.


