Fig. 4
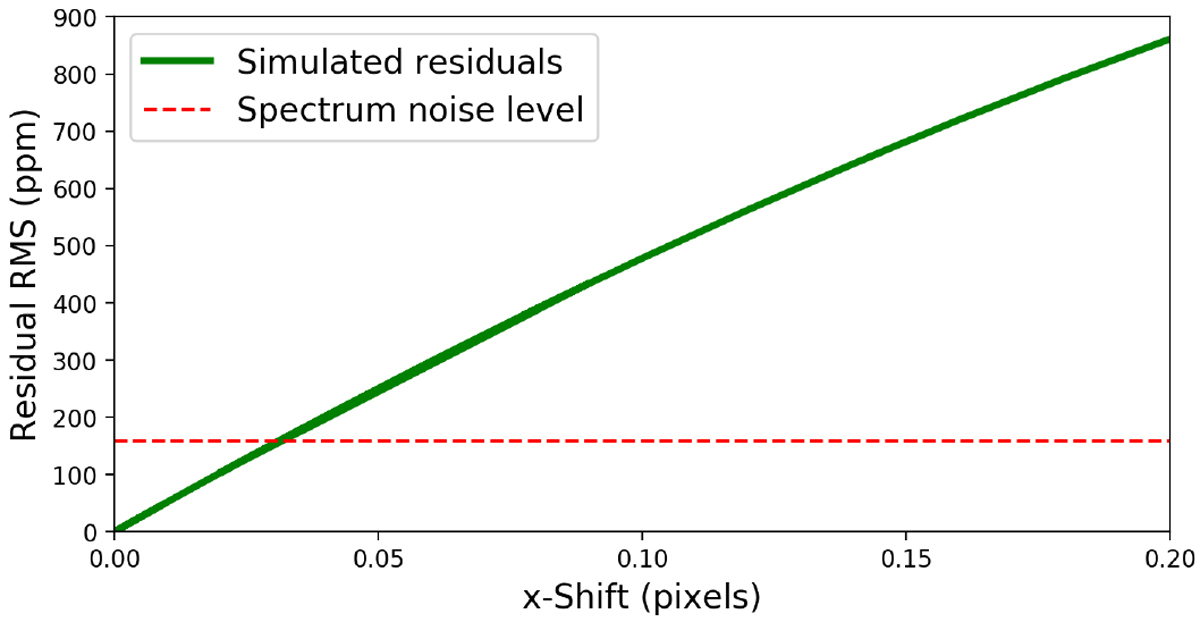
Simulated residuals as caused by spectral under-sampling (green curve). The computation is made by a convolution of a stellar spectrum at the resolution of the data, which is subsequently interpolated for each positional shift. The dashed red line is the noise level of the extracted eclipse spectrum. This simulation does not include the propagation of flat-field uncertainties, which will act to further increase the residual noise.
Current usage metrics show cumulative count of Article Views (full-text article views including HTML views, PDF and ePub downloads, according to the available data) and Abstracts Views on Vision4Press platform.
Data correspond to usage on the plateform after 2015. The current usage metrics is available 48-96 hours after online publication and is updated daily on week days.
Initial download of the metrics may take a while.