Fig. 2
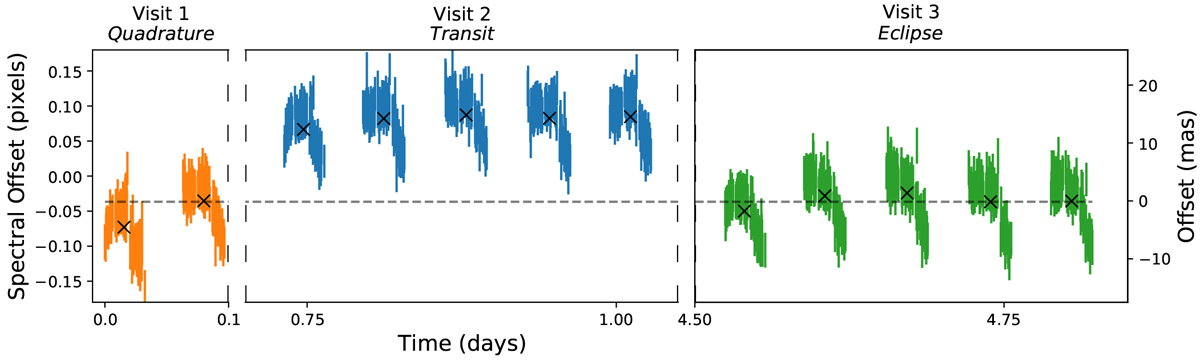
Offset of spectrum position in the dispersion direction relative to average over all exposures as described in Sect. 2.4. The x-axis shows the time in days, with line breaks between different visits. Coloured lines indicate the offset for each exposure with 1σ uncertainties. Black crosses are the average offset for each orbit, with the horizontal dashed line set to the quadrature orbit offset for visual reference.
Current usage metrics show cumulative count of Article Views (full-text article views including HTML views, PDF and ePub downloads, according to the available data) and Abstracts Views on Vision4Press platform.
Data correspond to usage on the plateform after 2015. The current usage metrics is available 48-96 hours after online publication and is updated daily on week days.
Initial download of the metrics may take a while.