Fig. 4.
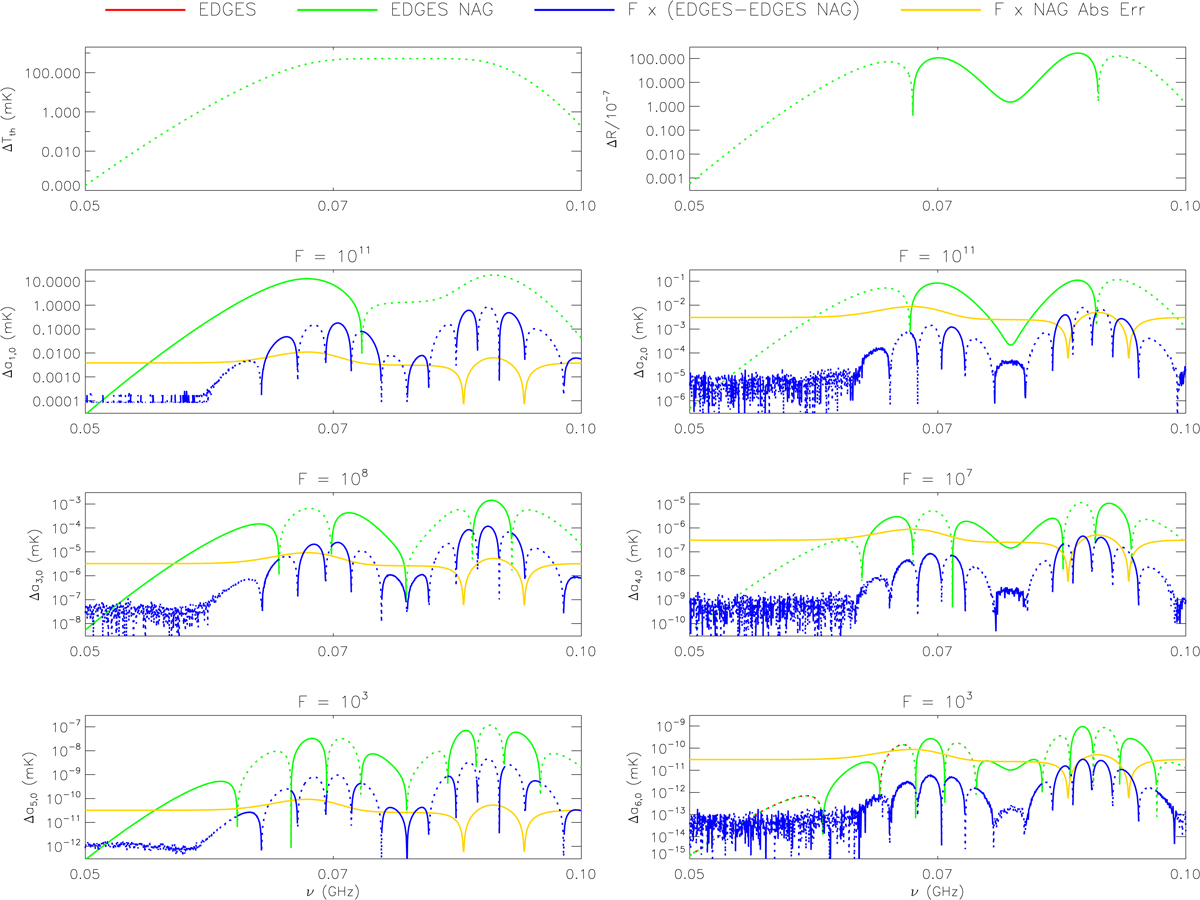
ΔTth, ΔR and Δaℓ, 0 from ℓ = 1 to ℓmax = 6 for the EDGES profile of redshifted 21 cm line (summed in intensity with the CMB blackbody). Solid lines (or dots) correspond to positive (or negative) values. Red and green lines are essentially superimposed at any ℓ. Their difference, multiplied by a factor F to have values compatible with the adopted range, is displayed by the blue lines. Yellow lines refer to the nominal integration error quoted by the routine D01AJF, again multiplied by the factor F. See also the legend and the text.
Current usage metrics show cumulative count of Article Views (full-text article views including HTML views, PDF and ePub downloads, according to the available data) and Abstracts Views on Vision4Press platform.
Data correspond to usage on the plateform after 2015. The current usage metrics is available 48-96 hours after online publication and is updated daily on week days.
Initial download of the metrics may take a while.