Fig. 3.
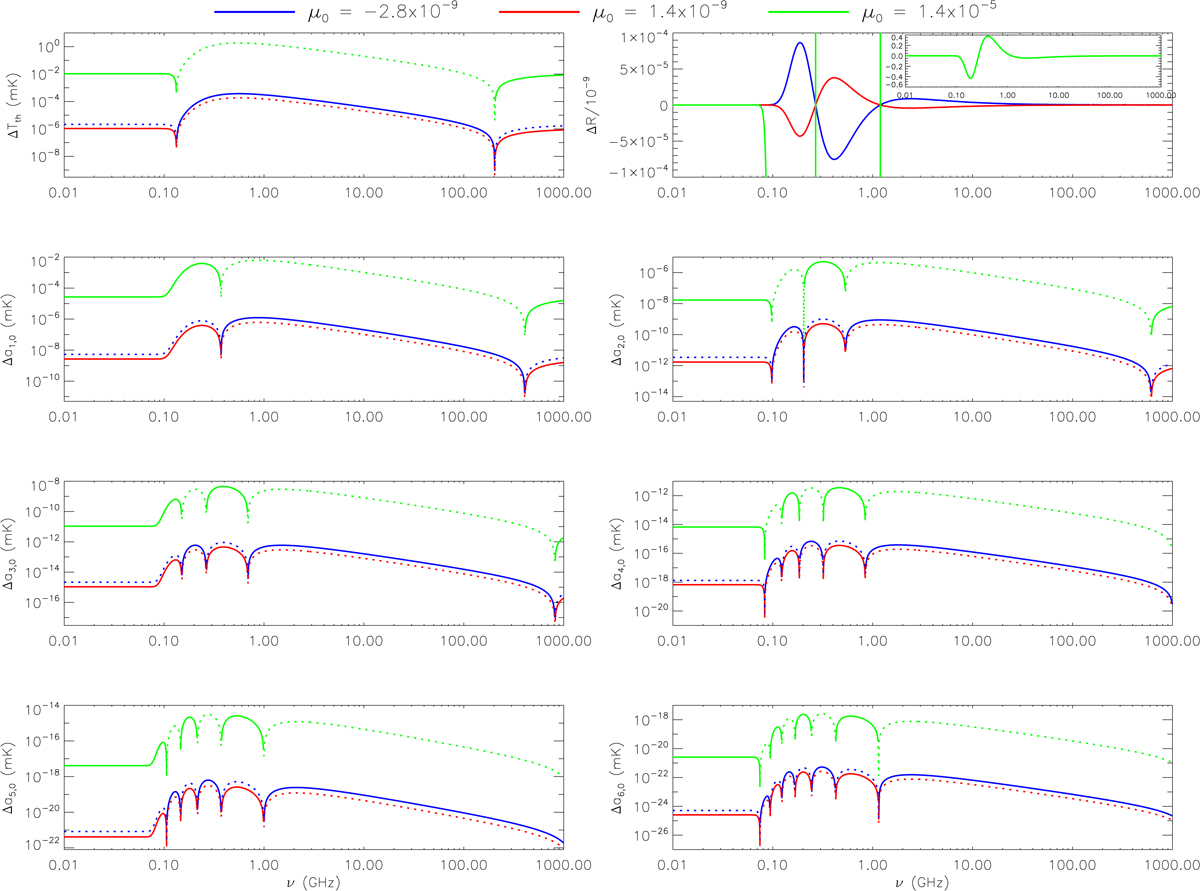
ΔTth, ΔR, and Δaℓ, 0 from ℓ = 1 to ℓmax = 6 for the considered BE-like distortion models. The inset in the top-right panel shows separately the case with the highest value of μ0, which cannot be appreciated in the main panel as it is targeted to much lower values of μ0, in order to appreciate the extremely similar spectral shape of the red and green lines. Except in the top-right panel where ΔR is shown in linear scale, solid lines (or dots) correspond to positive (or negative) values. See also the legend and the text.
Current usage metrics show cumulative count of Article Views (full-text article views including HTML views, PDF and ePub downloads, according to the available data) and Abstracts Views on Vision4Press platform.
Data correspond to usage on the plateform after 2015. The current usage metrics is available 48-96 hours after online publication and is updated daily on week days.
Initial download of the metrics may take a while.