Fig. B.1.
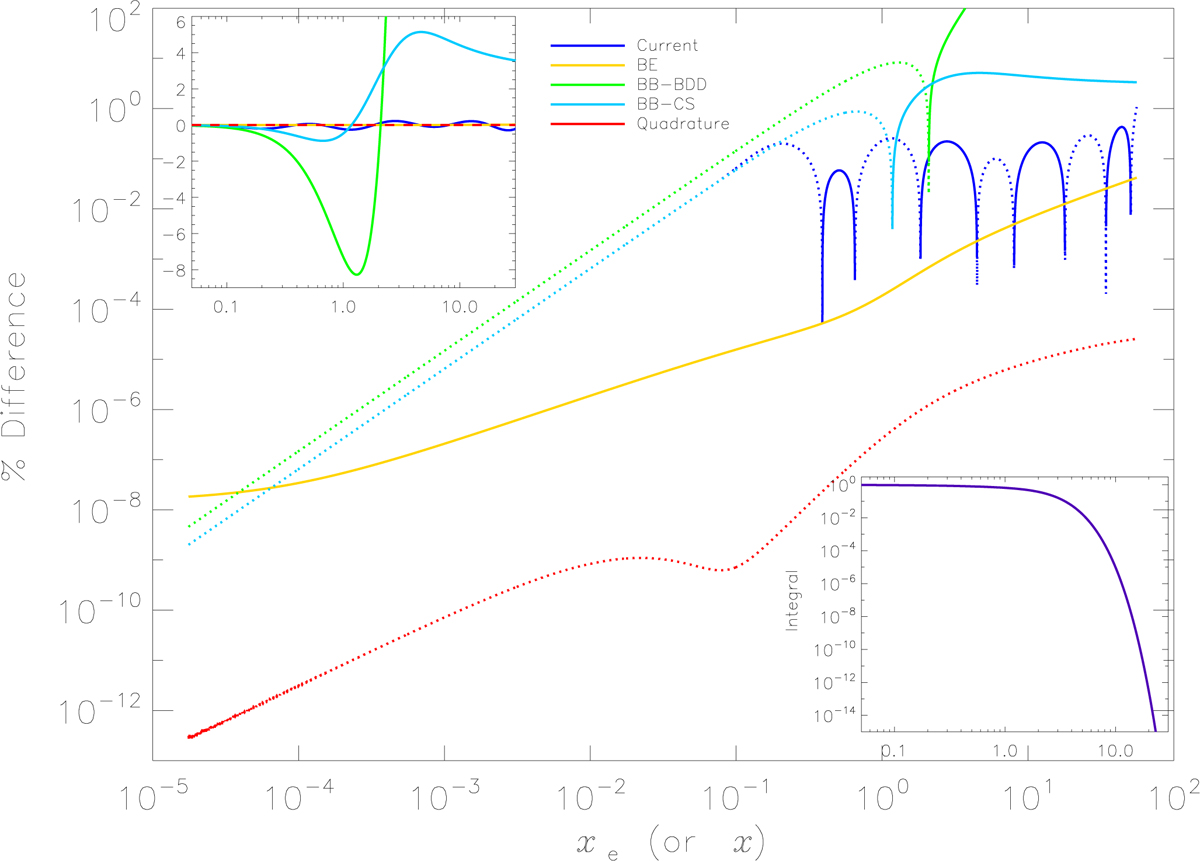
Comparison between the results of various approximations and accurate numerical integrations of Eq. (B.1). The bottom-right inset gives the numerical result derived with the NAG routine D01AJF with a relative accuracy of 10−12 in the case of the blackbody spectrum. The main plot reports the per cent difference of various estimations of Eq. (B.1) with respect to the NAG D01AJF result for the blackbody spectrum: the approximation presented here (Current, see Eq. (B.5)); the NAG D01AJF result but for a pure BE spectrum with μ0 = 1.4 × 10⁻⁵ (BE); the approximations reported in Burigana et al. (1991a) (BB-BDD, see Eq. (B.3)) and in Chluba & Sunyaev (2012) (BB-CS, see Eq. (B.4)); the numerical result derived with a Gaussian quadrature scheme (Press 1992) with the accuracy parameter (EPS) set to 10−9 and 2048 points in the case of the blackbody spectrum. Solid lines (or dots) correspond to positive (or negative) values. The top-left inset displays the same results of the main plot, but in a restricted frequency range and with a linear scale on the y-axis. See also the legend and the text.
Current usage metrics show cumulative count of Article Views (full-text article views including HTML views, PDF and ePub downloads, according to the available data) and Abstracts Views on Vision4Press platform.
Data correspond to usage on the plateform after 2015. The current usage metrics is available 48-96 hours after online publication and is updated daily on week days.
Initial download of the metrics may take a while.