Fig. B.1
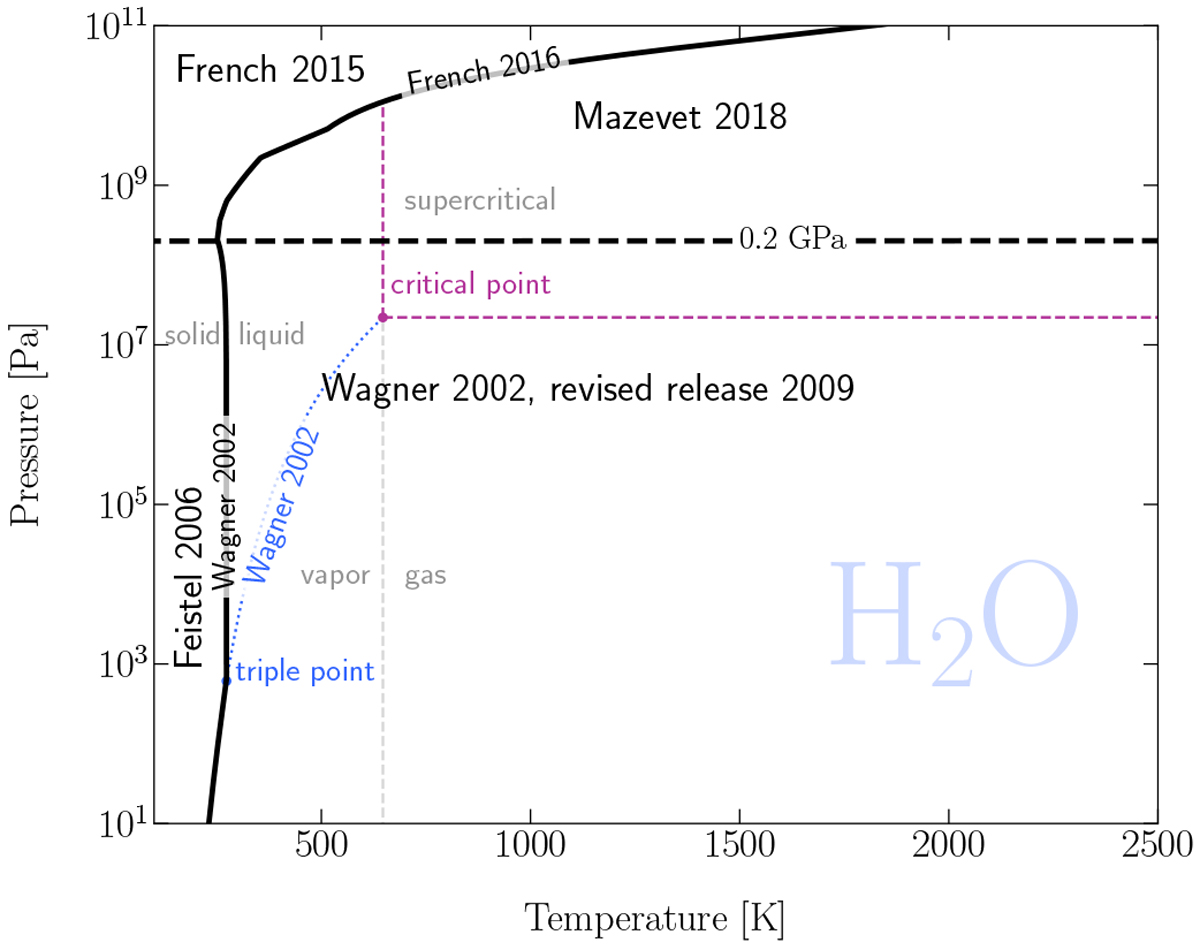
Phase diagram of pure water showing the four distinct EoS regions used in this study (thick black curves). The black, solid curve is the solid-liquid phase boundary above the triple point and the sublimation curve below the triple point. The black, dashed horizontal line shows the pressure where we switch from the low pressure EoS to the high pressure one. The high pressure ices (French et al. 2015) include ices VII and X. Other high pressure ice phases are not considered at this stage. The solid-liquid phase boundary is computed following Wagner et al. (2002) and French et al. (2016) for the low and high pressure regimes, respectively.
Current usage metrics show cumulative count of Article Views (full-text article views including HTML views, PDF and ePub downloads, according to the available data) and Abstracts Views on Vision4Press platform.
Data correspond to usage on the plateform after 2015. The current usage metrics is available 48-96 hours after online publication and is updated daily on week days.
Initial download of the metrics may take a while.