Fig. 10
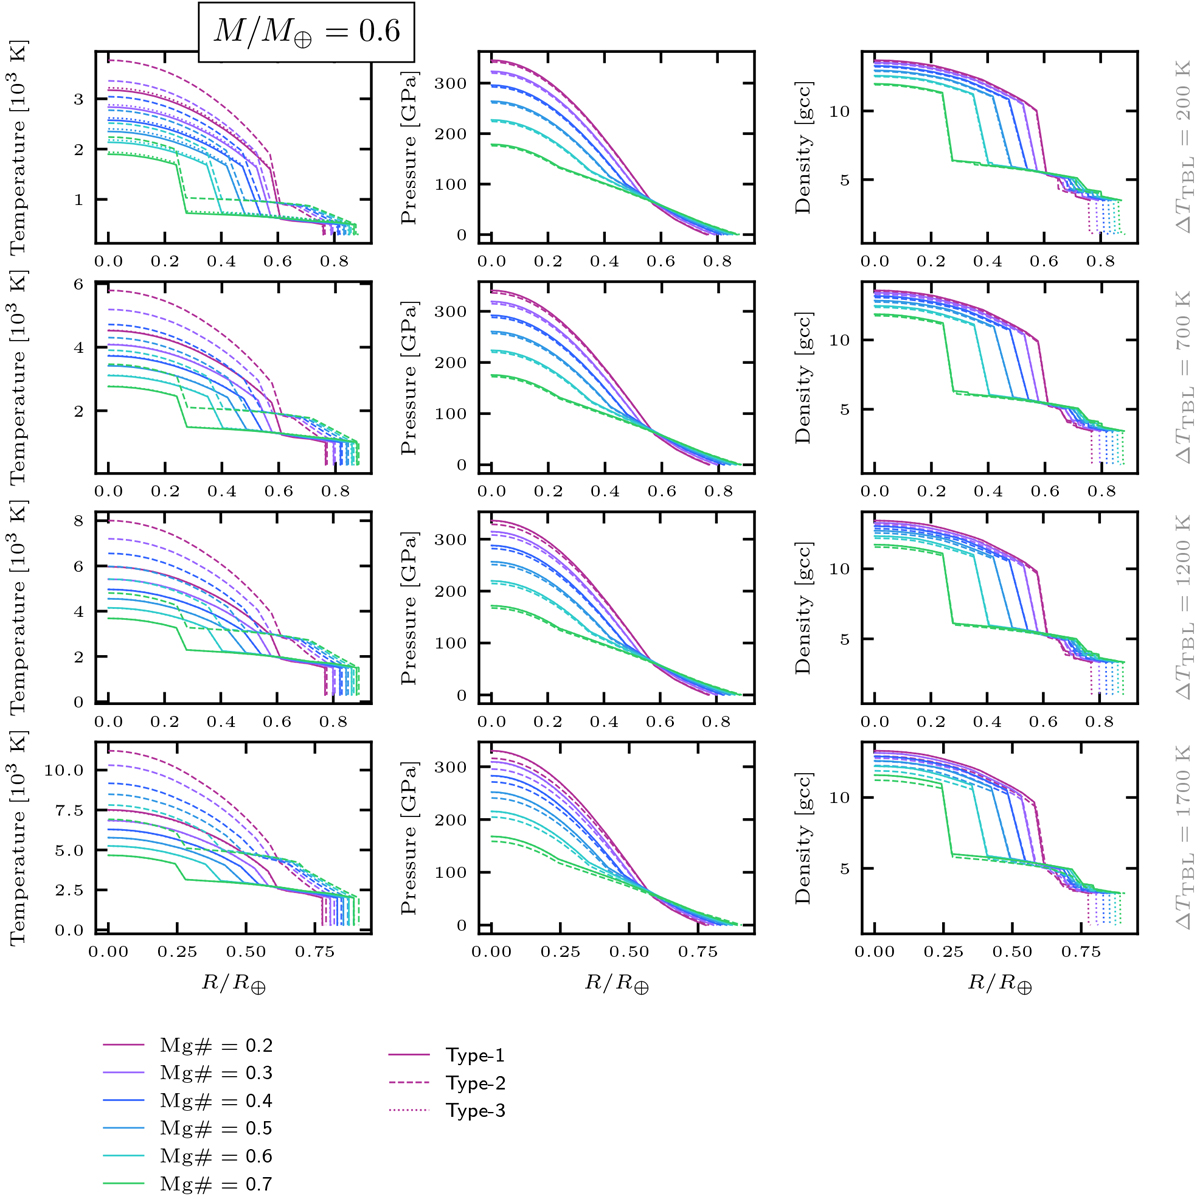
Internal profiles as functions of radial distance from the centre for M∕M⊕ = 0.6 for all modelled ΔTTBL and compositions for the temperature (left column), pressure (middle column), and density (right column). The solid curves correspond to Type-1 planets, the dashed curves to Type-2 planets and the dotted curves to Type-3 planets (see text for details). Since hydration tends to steepen the temperature gradient in the mantle, the Type-2 planets exhibit generally higher temperatures in the interiors than their Type-1 and Type-3 analogues.
Current usage metrics show cumulative count of Article Views (full-text article views including HTML views, PDF and ePub downloads, according to the available data) and Abstracts Views on Vision4Press platform.
Data correspond to usage on the plateform after 2015. The current usage metrics is available 48-96 hours after online publication and is updated daily on week days.
Initial download of the metrics may take a while.