Fig. 9.
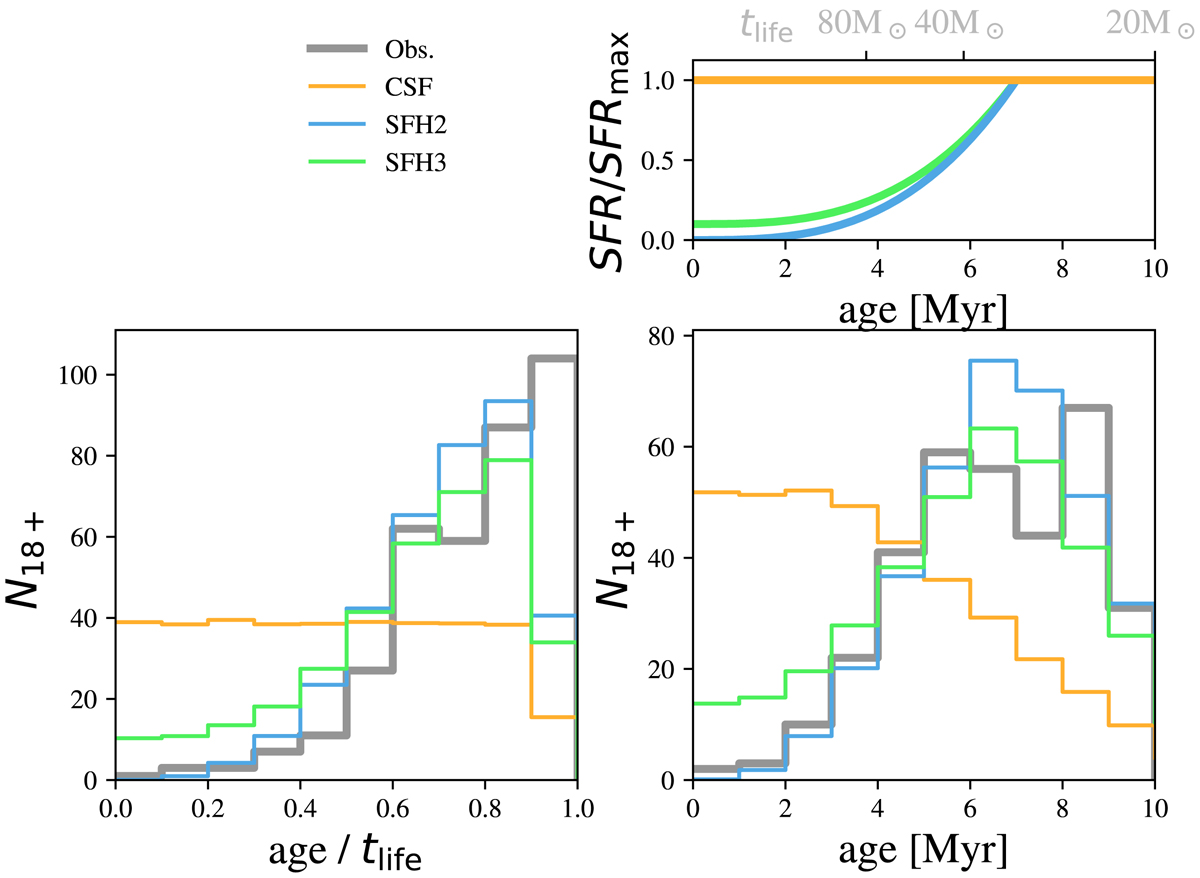
Fractional age (bottom left) and absolute age (bottom right) distribution of the number of stars that are above the 18 M⊙ track (referred to as N18+) in Fig. 5. The colored distributions are theoretical predictions for CSF, and two other star formation histories (SFH2 and SFH3) where young stars have a lower probability (top right panel). The gray line indicates the distribution that we derived using observations.
Current usage metrics show cumulative count of Article Views (full-text article views including HTML views, PDF and ePub downloads, according to the available data) and Abstracts Views on Vision4Press platform.
Data correspond to usage on the plateform after 2015. The current usage metrics is available 48-96 hours after online publication and is updated daily on week days.
Initial download of the metrics may take a while.