Fig. D.1.
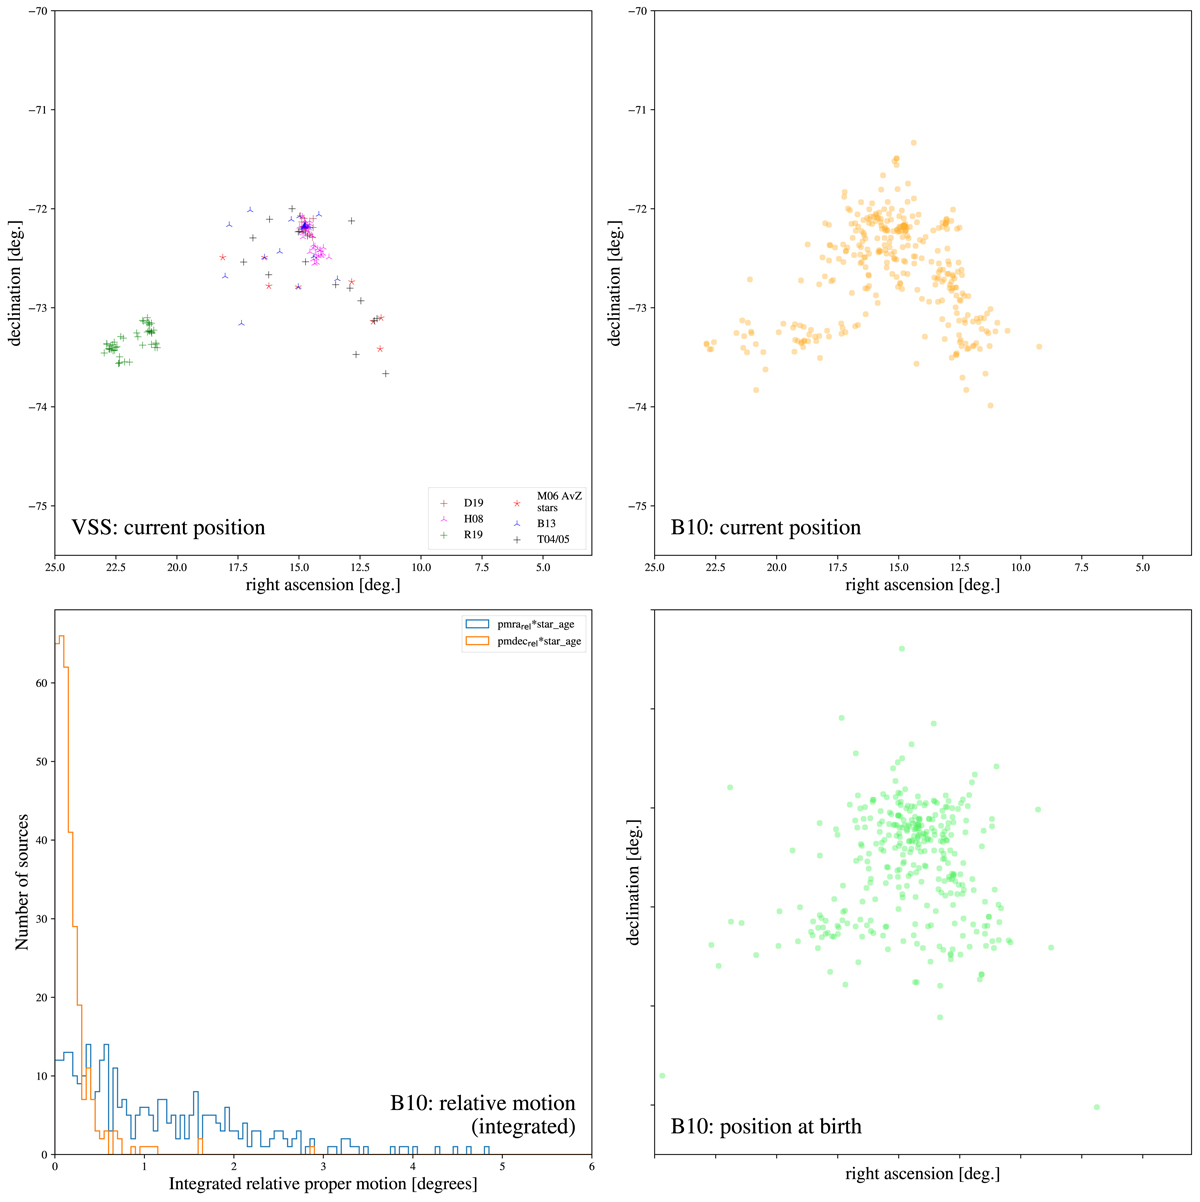
Diagrams showing positions and motions of sources in the Small Magellanic Cloud. The top left panel shows the positions of the sources that are in the VSS. The bottom left panel shows the distribution of the integrated motion relative to the SMC of B10 sources (that are above the 18 M⊙ track in Fig. 5) since their birth (see text). The top and bottom right panel show the positions of these B10 sources now and integrated to their their moment of birth in the SMC, respectively.
Current usage metrics show cumulative count of Article Views (full-text article views including HTML views, PDF and ePub downloads, according to the available data) and Abstracts Views on Vision4Press platform.
Data correspond to usage on the plateform after 2015. The current usage metrics is available 48-96 hours after online publication and is updated daily on week days.
Initial download of the metrics may take a while.