Fig. 2.
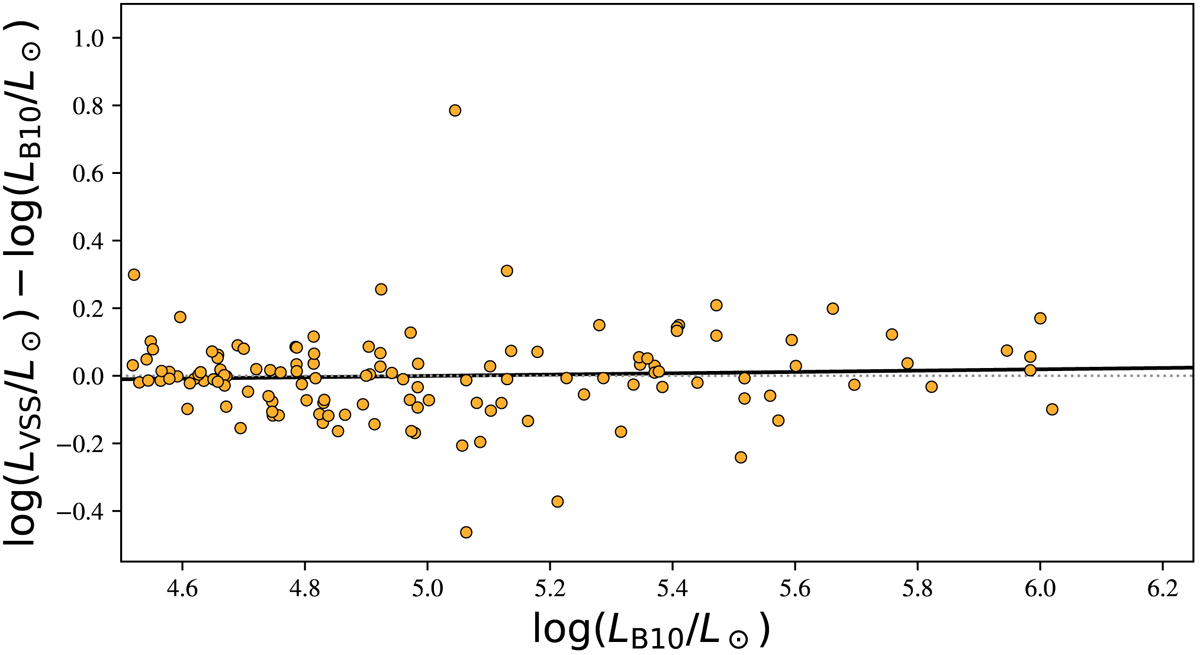
Difference between the logarithm of the luminosities reported in the various spectroscopic studies (VSS) sample and those derived by our method using spectral types of B10 as a function of log(LB10/L⊙). Each dot represents an individual source. The dotted line shows where LB10 = LVSS; the solid line is a linear fit to the scatter points.
Current usage metrics show cumulative count of Article Views (full-text article views including HTML views, PDF and ePub downloads, according to the available data) and Abstracts Views on Vision4Press platform.
Data correspond to usage on the plateform after 2015. The current usage metrics is available 48-96 hours after online publication and is updated daily on week days.
Initial download of the metrics may take a while.