Fig. A.1.
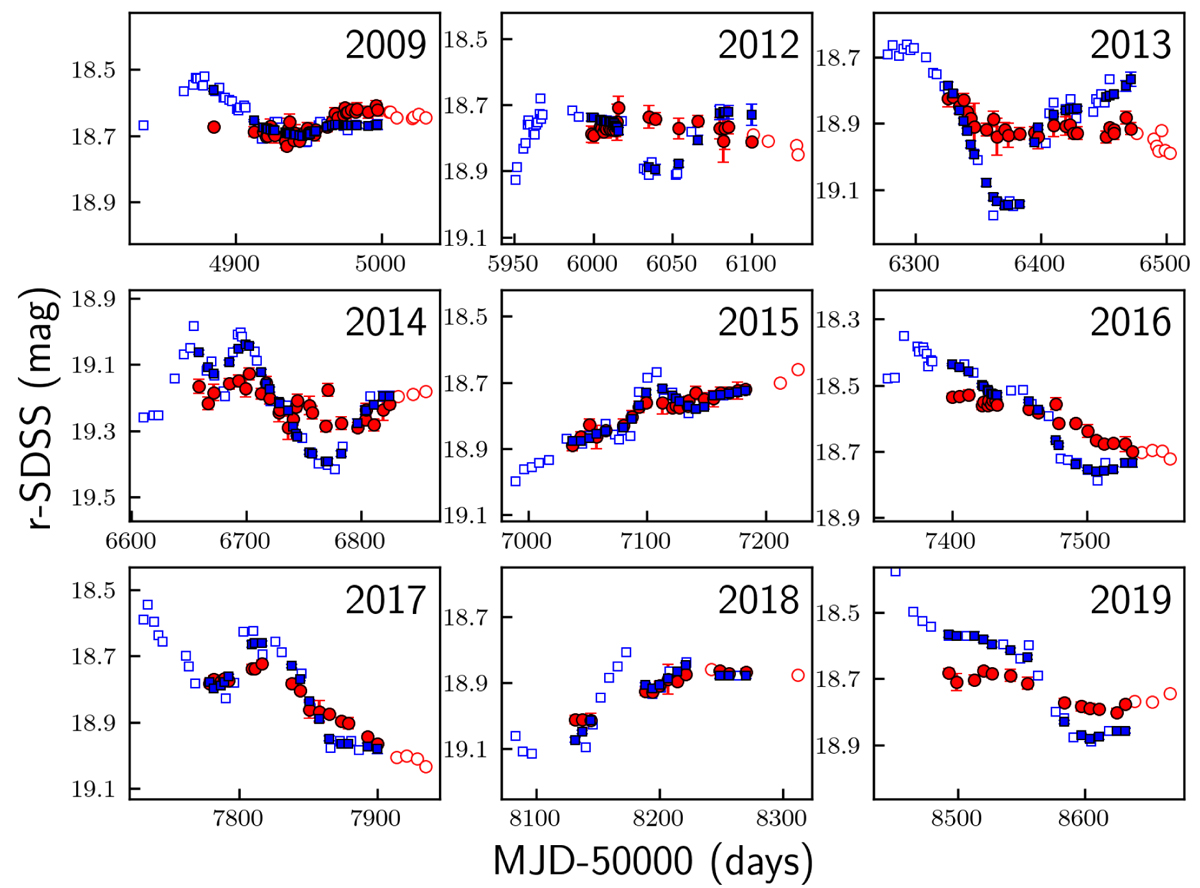
Combined light curve in the r band from the best solution in the third column of Table A.1. The A curve (red circles) is compared to the magnitude- and time-shifted B curve (blue squares). Open circles and squares are associated with the full brightness records, while filled circles and squares correspond to periods of overlap between both records. In the overlap periods, magnitudes of B are binned around dates of A using α = 20 d (filled squares; see main text).
Current usage metrics show cumulative count of Article Views (full-text article views including HTML views, PDF and ePub downloads, according to the available data) and Abstracts Views on Vision4Press platform.
Data correspond to usage on the plateform after 2015. The current usage metrics is available 48-96 hours after online publication and is updated daily on week days.
Initial download of the metrics may take a while.