Fig. 7.
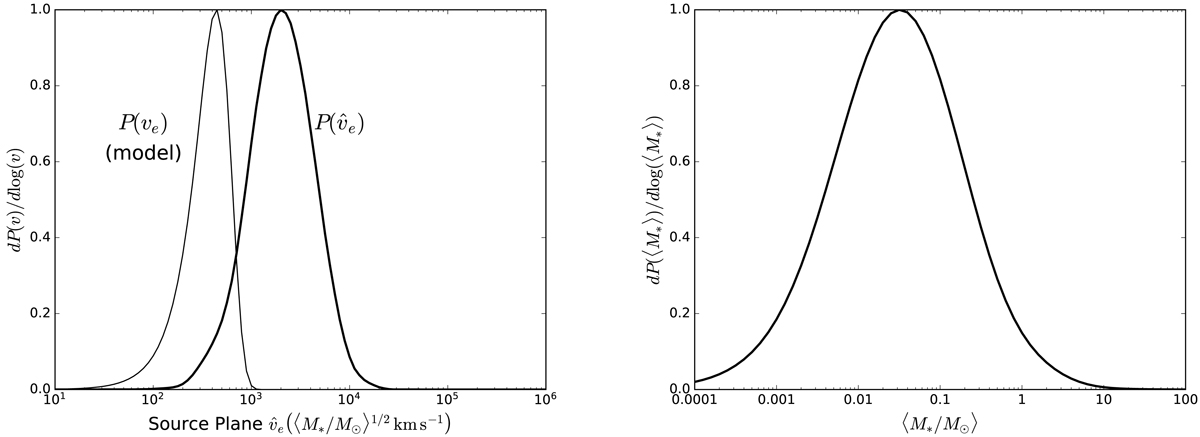
Distributions for the effective source velocity and mean microlens mass. Left panel: probability density for the effective velocity ![]() (in Einstein units ⟨M*/M⊙⟩1/2 km s−1) across the source plane from the ensemble of Monte Carlo fits to the observed light curves (heavy black curve). The lighter black curve is our prior on the true effective velocity of source (in physical units km s−1) generated from a model of the effective velocity of source, lens, observer and the velocity dispersion of lens galaxy stars. Right panel: probability density for the mean mass of a lens galaxy star ⟨M*⟩ derived by convolving the probability density for the effective velocity
(in Einstein units ⟨M*/M⊙⟩1/2 km s−1) across the source plane from the ensemble of Monte Carlo fits to the observed light curves (heavy black curve). The lighter black curve is our prior on the true effective velocity of source (in physical units km s−1) generated from a model of the effective velocity of source, lens, observer and the velocity dispersion of lens galaxy stars. Right panel: probability density for the mean mass of a lens galaxy star ⟨M*⟩ derived by convolving the probability density for the effective velocity ![]() with our model for the true effective velocity (see left panel). Since
with our model for the true effective velocity (see left panel). Since ![]() , the distribution is broad. The expectation value for
, the distribution is broad. The expectation value for ![]() is lower than the predictions of standard IMF models, but our results for the accretion disc size are consistent when we assume a more physical uniform prior 0.1 ≤ ⟨M*/M⊙⟩ ≤ 1.0 (see the right panel of Fig. 8).
is lower than the predictions of standard IMF models, but our results for the accretion disc size are consistent when we assume a more physical uniform prior 0.1 ≤ ⟨M*/M⊙⟩ ≤ 1.0 (see the right panel of Fig. 8).
Current usage metrics show cumulative count of Article Views (full-text article views including HTML views, PDF and ePub downloads, according to the available data) and Abstracts Views on Vision4Press platform.
Data correspond to usage on the plateform after 2015. The current usage metrics is available 48-96 hours after online publication and is updated daily on week days.
Initial download of the metrics may take a while.