Fig. 6.
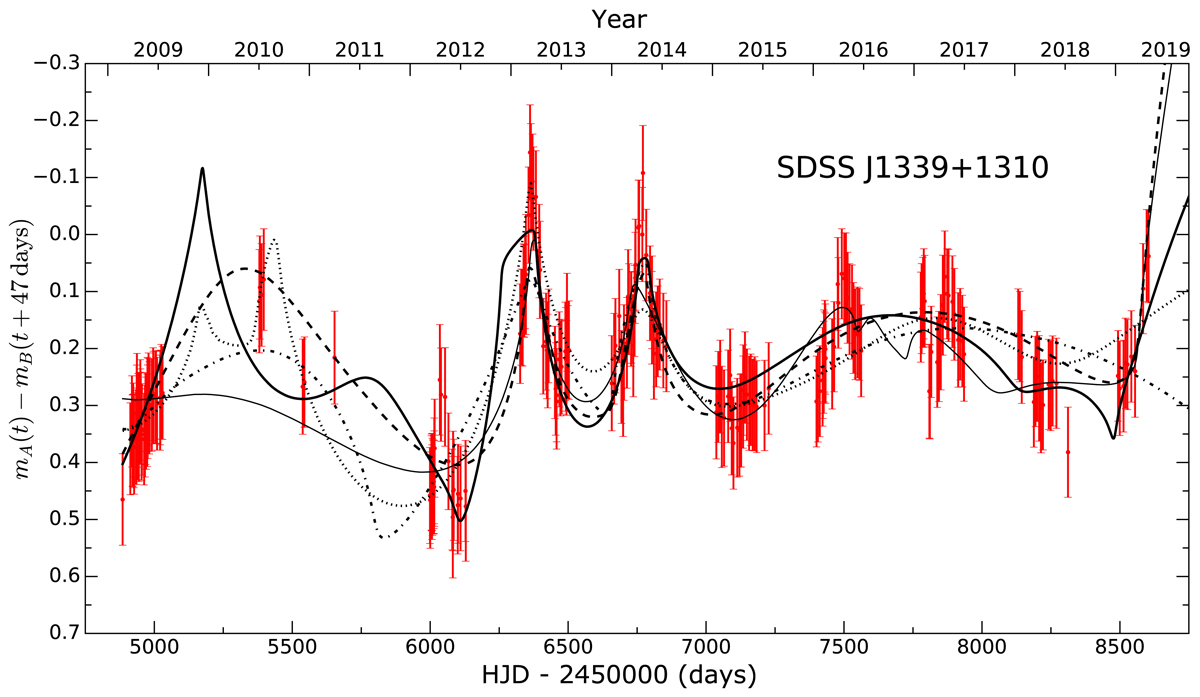
Image Br-band light curve from the LT shifted by the 47-d time delay and subtracted from the contemporaneous magnitude of image A, i.e. mA(t)−mB(t + 47 d) (equivalent to a ratio in flux units), leaving only variability that is not intrinsic to the source itself. Plotted in black are five good fits to the microlensing variability from our Monte Carlo routine.
Current usage metrics show cumulative count of Article Views (full-text article views including HTML views, PDF and ePub downloads, according to the available data) and Abstracts Views on Vision4Press platform.
Data correspond to usage on the plateform after 2015. The current usage metrics is available 48-96 hours after online publication and is updated daily on week days.
Initial download of the metrics may take a while.