Fig. 5.
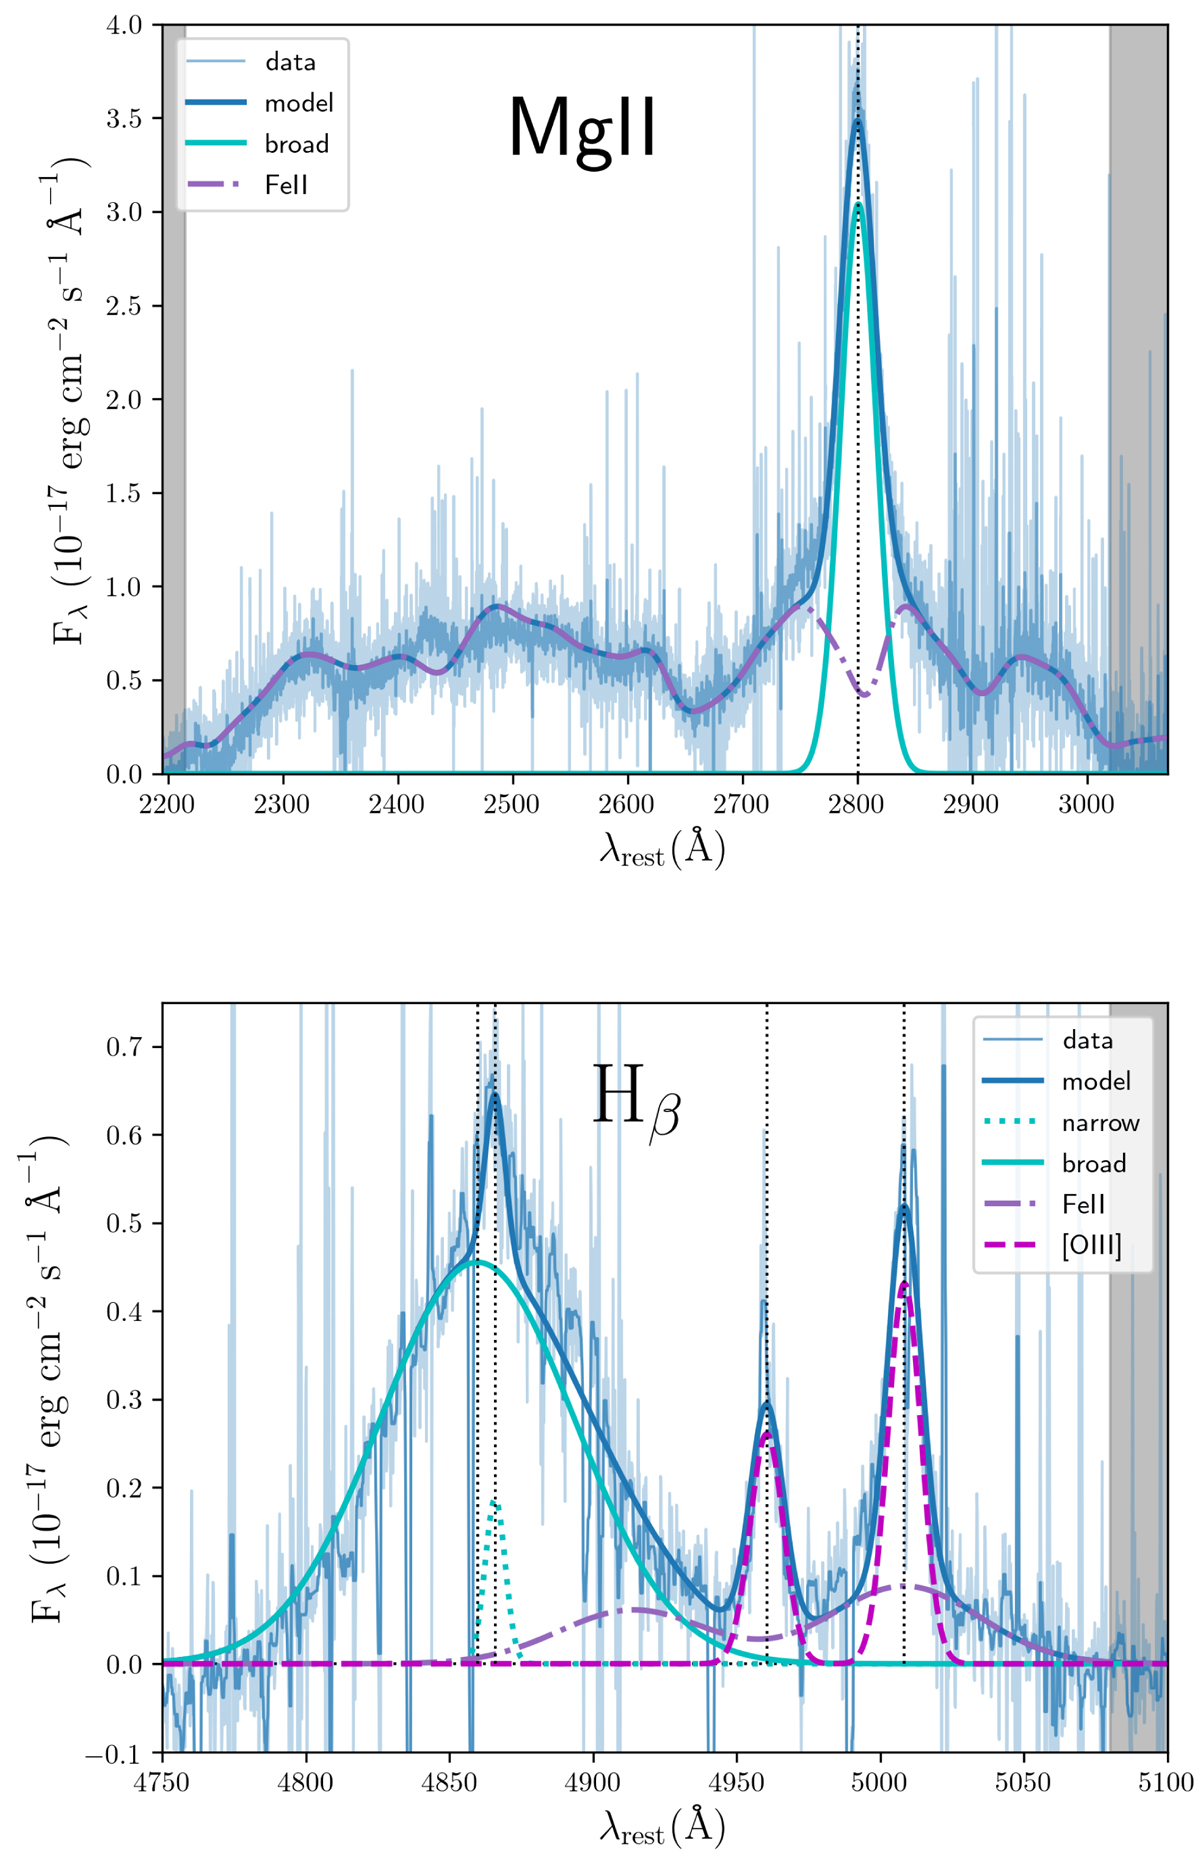
Multi-component decomposition of the Mg II and Hβ line profiles in SDSS J1339+1310A. The data correspond to VLT-X-shooter observations in April 2017. The original wavelength bins contain a very noisy signal (lighter blue), so a nine-point median filter is used to smooth original data (darker blue). In the top panel, after subtracting a power-law continuum, the residual signal is modelled as a sum of two contributions, i.e. Mg II broad emission (Gaussian curve around the vertical dotted line) and Fe II pseudo-continuum. There is no evidence of a Mg II narrow line or an additional very broad component. The continuum windows at 2195−2215 Å and 3020−3070 Å are highlighted using grey rectangles, and the Fe II pseudo-continuum is created from the Fe II template of Tsuzuki et al. (2006) convolved with a Gaussian function to account for the Doppler broadening of Fe II lines. Bottom panel: decomposition in the spectral region around the Hβ emission. The grey rectangle highlights one of the two windows that we used to remove a power-law continuum under emission lines (3790−3810 Å and 5080−5100 Å; Kuraszkiewicz et al. 2002). The residual signal is decomposed into four Gaussian components: Hβ broad + Hβ narrow + [O III] doublet, plus the Fe II contribution from two individual lines in the spectral range 4750−5100 Å (e.g. Kovačević et al. 2010). Vertical dotted lines show the centres of the four Gaussians.
Current usage metrics show cumulative count of Article Views (full-text article views including HTML views, PDF and ePub downloads, according to the available data) and Abstracts Views on Vision4Press platform.
Data correspond to usage on the plateform after 2015. The current usage metrics is available 48-96 hours after online publication and is updated daily on week days.
Initial download of the metrics may take a while.