Fig. 4.
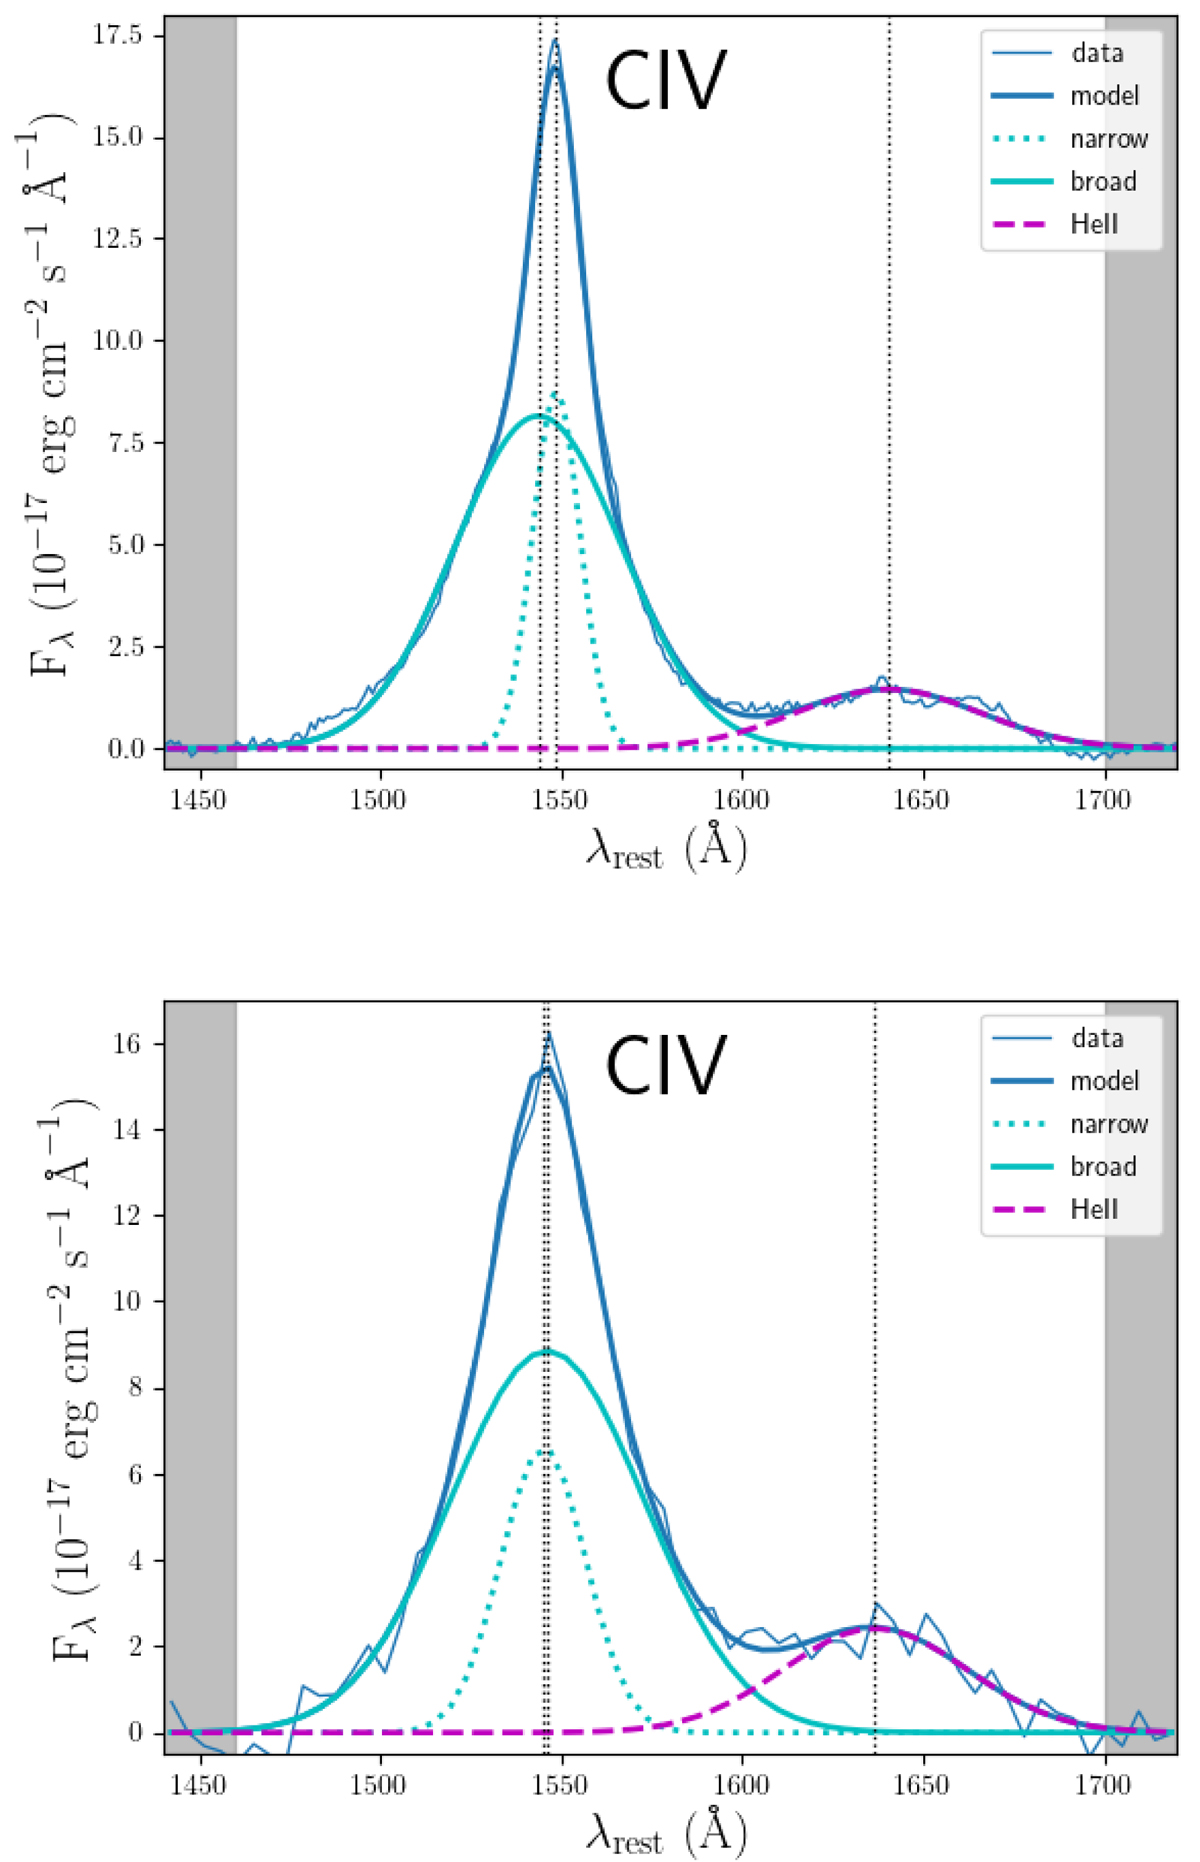
Multi-component decomposition of the C IV line profile in SDSS J1339+1310A. The profile is decomposed into three Gaussian components: C IV broad + C IV narrow + He II complex. The grey rectangles highlight the two spectral regions that we used to remove a linear continuum under the emission line, and the vertical dotted lines correspond to the centres of the Gaussians. Top panel: GTC-OSIRIS-R500B data in May 2014, while bottom panel: HST-WFC3-UVIS data in February 2016.
Current usage metrics show cumulative count of Article Views (full-text article views including HTML views, PDF and ePub downloads, according to the available data) and Abstracts Views on Vision4Press platform.
Data correspond to usage on the plateform after 2015. The current usage metrics is available 48-96 hours after online publication and is updated daily on week days.
Initial download of the metrics may take a while.