Free Access
Fig. 3.
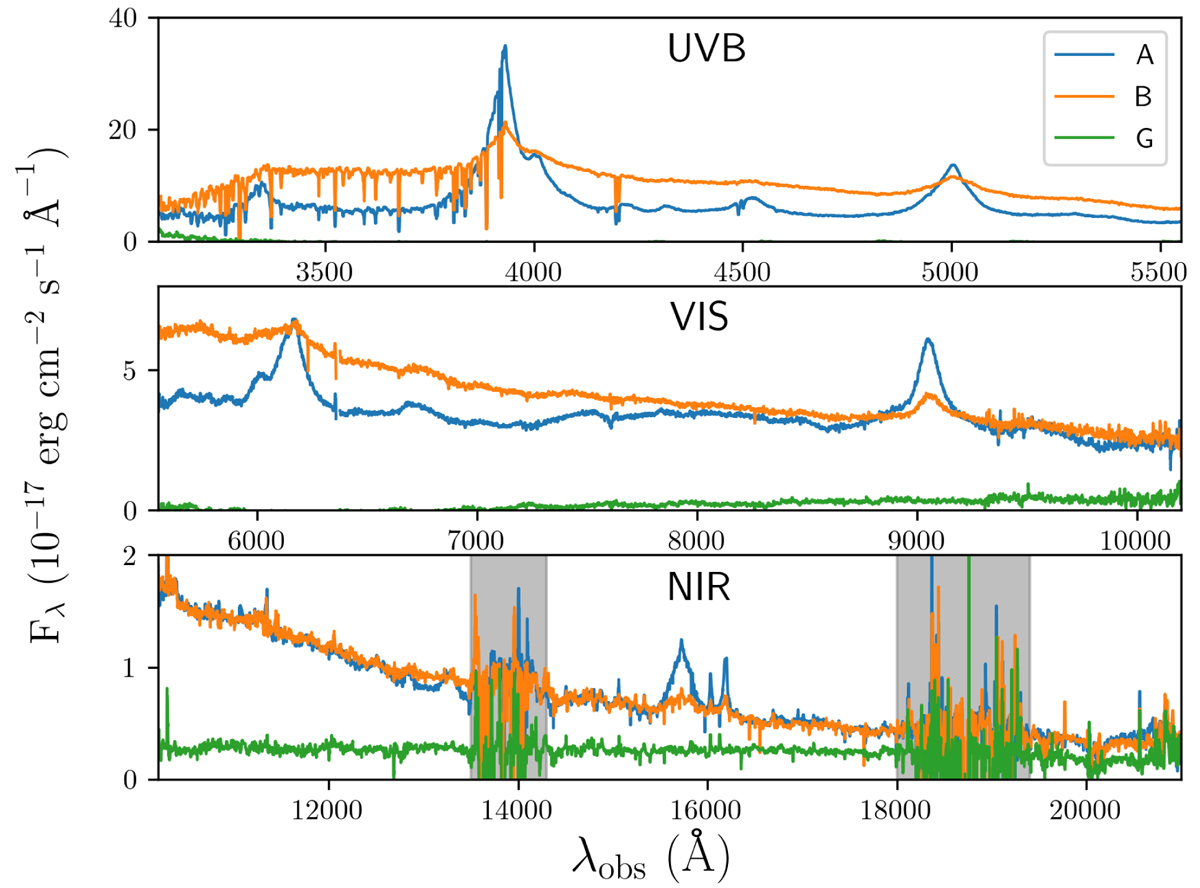
VLT-X-shooter spectra of SDSS J1339+1310ABG in April 2017. The fluxes in the UVB, VIS, and NIR arms are depicted in the top, middle, and bottom panels, respectively. Grey highlighted regions display very noisy behaviours that are related to strong atmospheric absorption.
Current usage metrics show cumulative count of Article Views (full-text article views including HTML views, PDF and ePub downloads, according to the available data) and Abstracts Views on Vision4Press platform.
Data correspond to usage on the plateform after 2015. The current usage metrics is available 48-96 hours after online publication and is updated daily on week days.
Initial download of the metrics may take a while.