Free Access
Fig. 2.
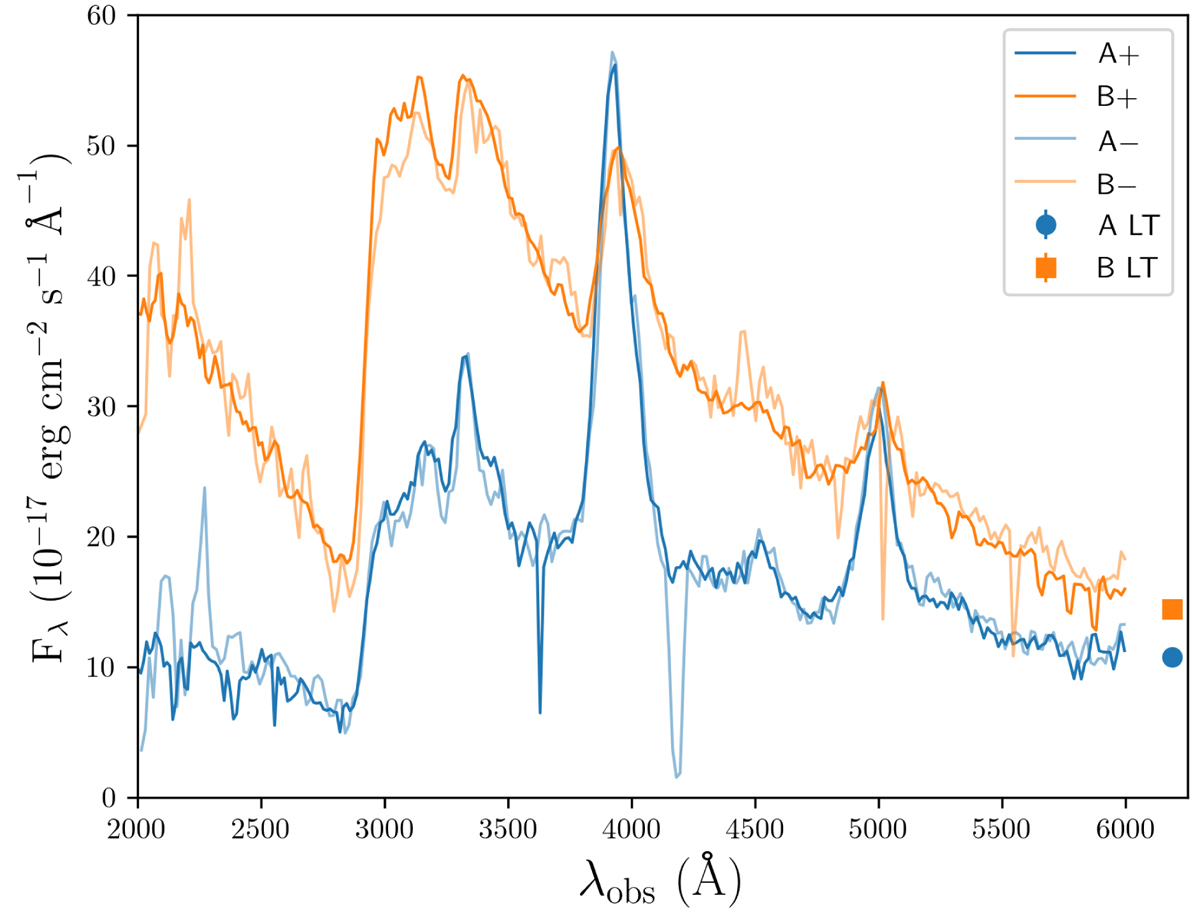
HST-WFC3-UVIS spectra of SDSS J1339+1310AB in February 2016. The first order spectra are A+ and B+ (+1st order data), as well as A− and B− (−1st order data). Fluxes from LT r-band frames on 14 February 2016 are also shown for comparison purposes.
Current usage metrics show cumulative count of Article Views (full-text article views including HTML views, PDF and ePub downloads, according to the available data) and Abstracts Views on Vision4Press platform.
Data correspond to usage on the plateform after 2015. The current usage metrics is available 48-96 hours after online publication and is updated daily on week days.
Initial download of the metrics may take a while.