Fig. 5
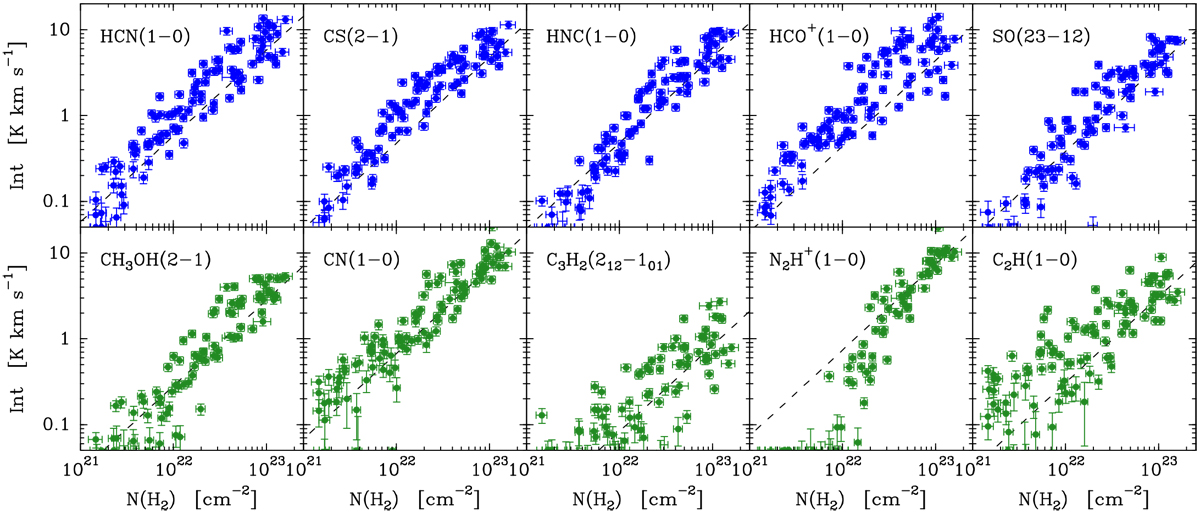
Integrated line intensity as a function of H2 column density for the survey species detected in at least five column density bins. Top: traditional dense gas tracers (blue symbols). Bottom: additional tracers of dense gas (green symbols). For reference, each panel shows a linear relation that fits the average intensity of the highest column density bin (dashed line). For HCN(1–0), CN(1–0), N2 H+(1–0), and C2 H(1–0), the intensity includes the contribution from all detected hyperfine components. For CH3 OH(2–1), the intensity includes the contribution from the A+ and E components. Depending on the transition, the lower limit of the intensity scale (0.05 K km s−1) approximately corresponds to one to three times the noise level in the integrated intensity.
Current usage metrics show cumulative count of Article Views (full-text article views including HTML views, PDF and ePub downloads, according to the available data) and Abstracts Views on Vision4Press platform.
Data correspond to usage on the plateform after 2015. The current usage metrics is available 48-96 hours after online publication and is updated daily on week days.
Initial download of the metrics may take a while.