Fig. 2
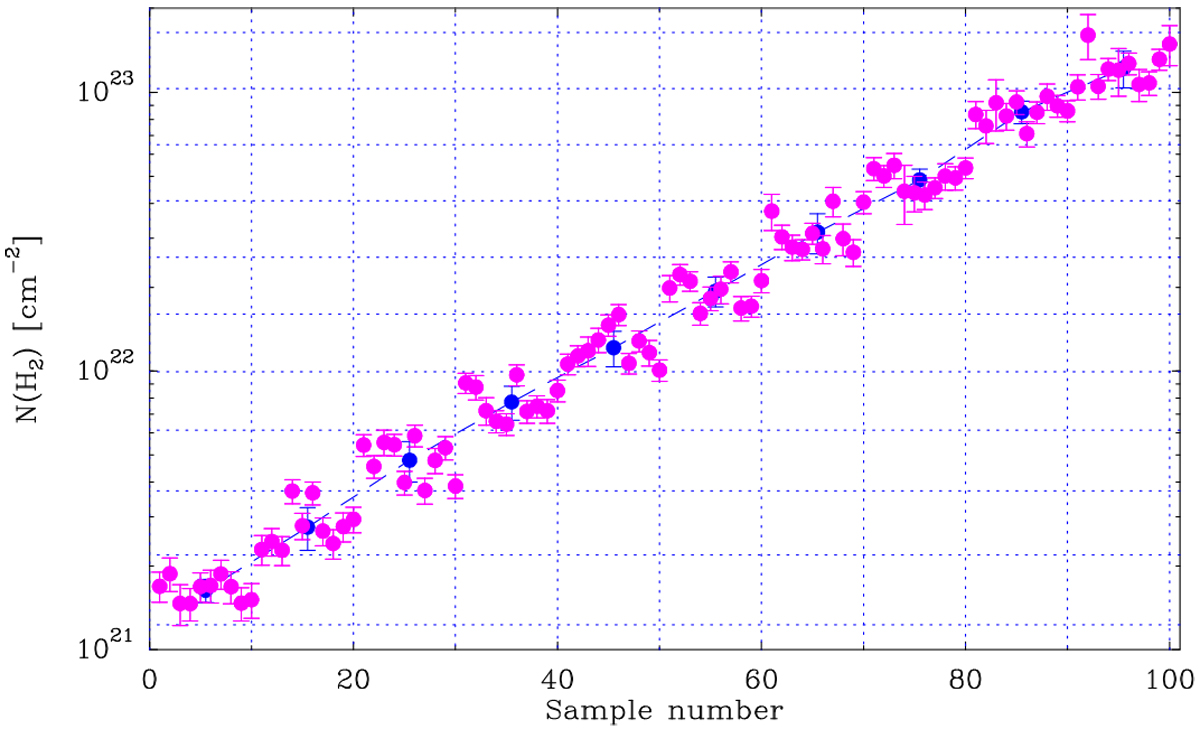
H2 column density as a function of sample number for the 100 positions randomly chosen to represent the Perseus molecular cloud (magenta circles). The dashed horizontal lines mark the boundaries of the ten column-density bins in which the cloud was divided, and the vertical lines enclose the ten points chosen to sample each bin. The blue circles indicate the geometrical mean of the H2 column densities inside each bin, and their error bars indicate their dispersion. All values derived from Zari et al. (2016) data.
Current usage metrics show cumulative count of Article Views (full-text article views including HTML views, PDF and ePub downloads, according to the available data) and Abstracts Views on Vision4Press platform.
Data correspond to usage on the plateform after 2015. The current usage metrics is available 48-96 hours after online publication and is updated daily on week days.
Initial download of the metrics may take a while.