Fig. 11
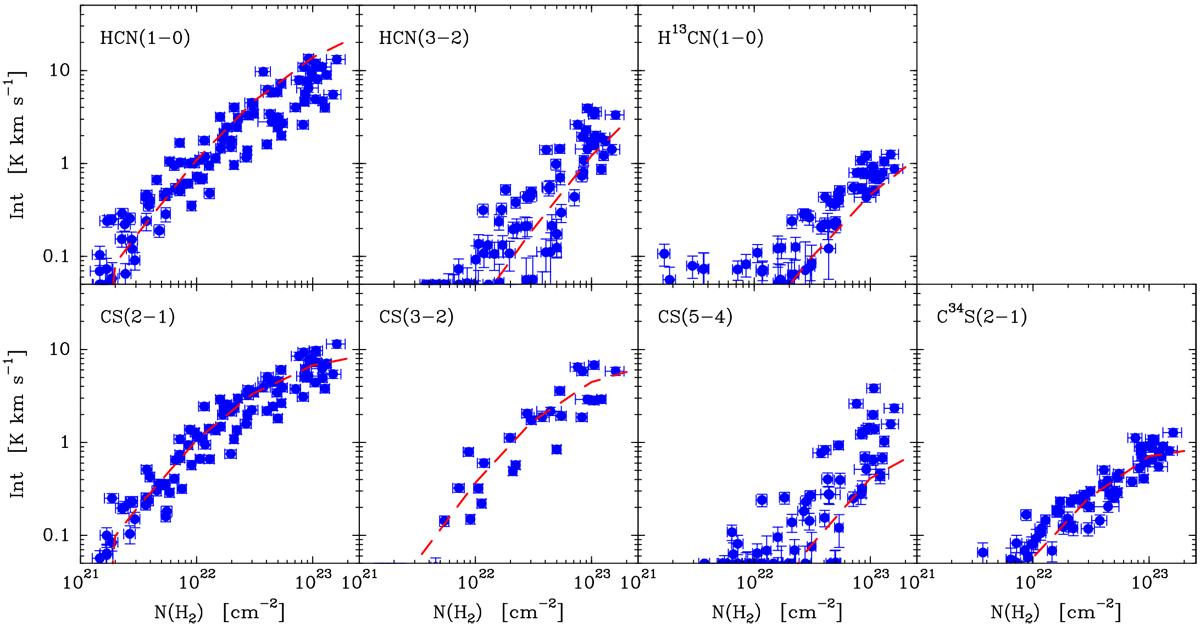
Comparison between observations and model results for HCN (top) and CS (bottom). Each row presents the intensity of the different transitions observed for the species (main and rare isotopologs) as a function of H2 column density (blue symbols) together with the predictions from the model (dashed red lines). The CS(3–2) dataset has fewer points due to the limited observations carried out in the 2 mm-wavelength band. Several H13 CN(1–0) points can be seen above the plot lower limit at very low column densities. A visual inspection of their spectra suggests that they represent noise or baseline residuals and not true molecular emission.
Current usage metrics show cumulative count of Article Views (full-text article views including HTML views, PDF and ePub downloads, according to the available data) and Abstracts Views on Vision4Press platform.
Data correspond to usage on the plateform after 2015. The current usage metrics is available 48-96 hours after online publication and is updated daily on week days.
Initial download of the metrics may take a while.