Fig. 1
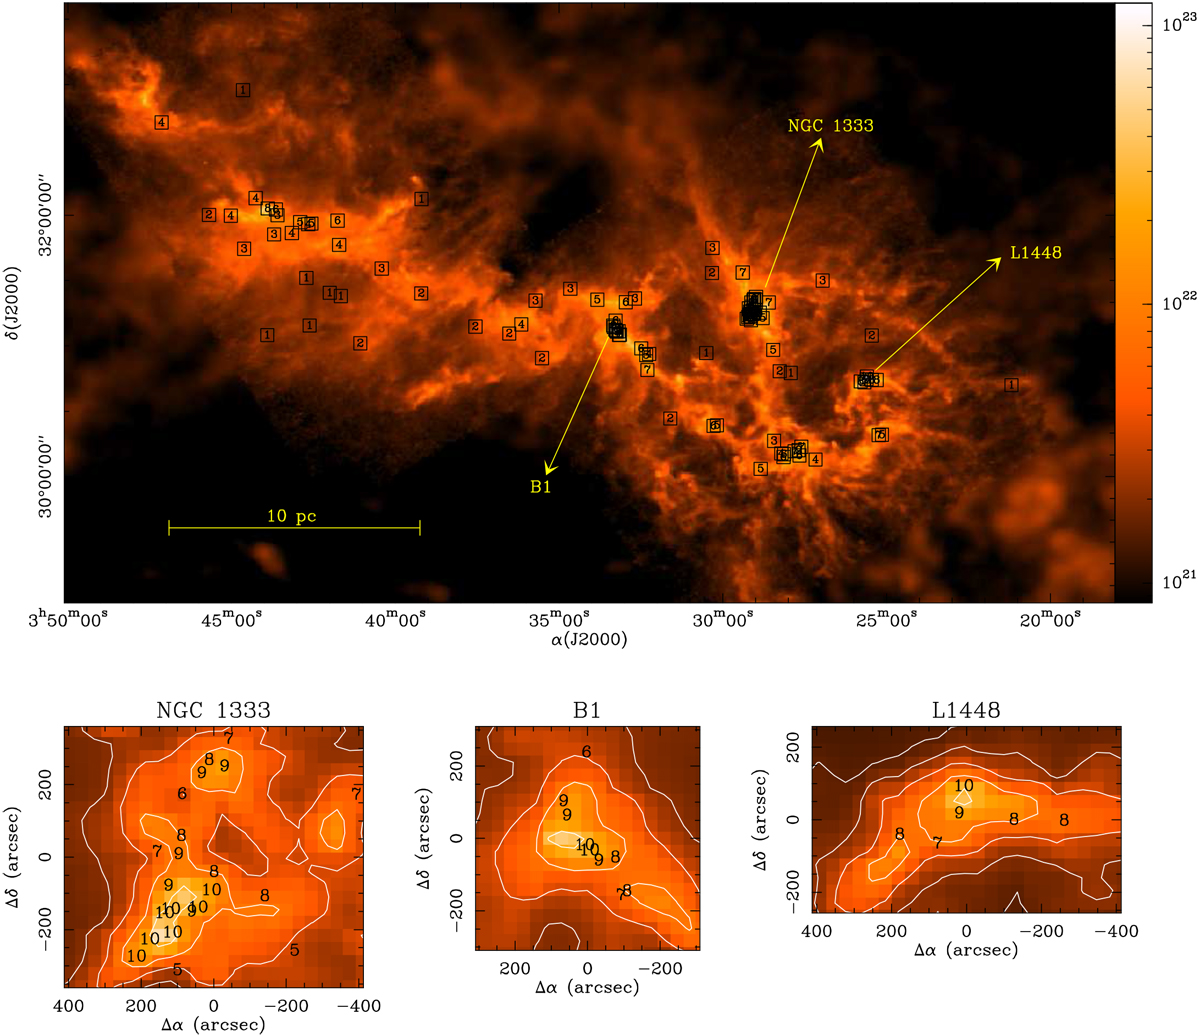
Sampling of the Perseus cloud. Top: H2 column density map of the Perseus molecular cloud from Zari et al. (2016) with squares indicating the location of the 100 positions selected to characterize the line emission from the cloud using stratified random sampling. The number in each square indicates the column density bin to which the position belongs, and ranges from 1 (lowest column density) to 10 (highest). Bottom: expanded view of the three regions that concentrate most of the high column density positions, and that correspond to the well-known star-forming regions NGC 1333, B1, and L1448. Contours are in units of N(H2), start at 1.25 × 1021 cm−2, and increaseby factors of 2.5. The 10 pc scale bar assumes a distance of 300 pc.
Current usage metrics show cumulative count of Article Views (full-text article views including HTML views, PDF and ePub downloads, according to the available data) and Abstracts Views on Vision4Press platform.
Data correspond to usage on the plateform after 2015. The current usage metrics is available 48-96 hours after online publication and is updated daily on week days.
Initial download of the metrics may take a while.