Free Access
Fig. 8
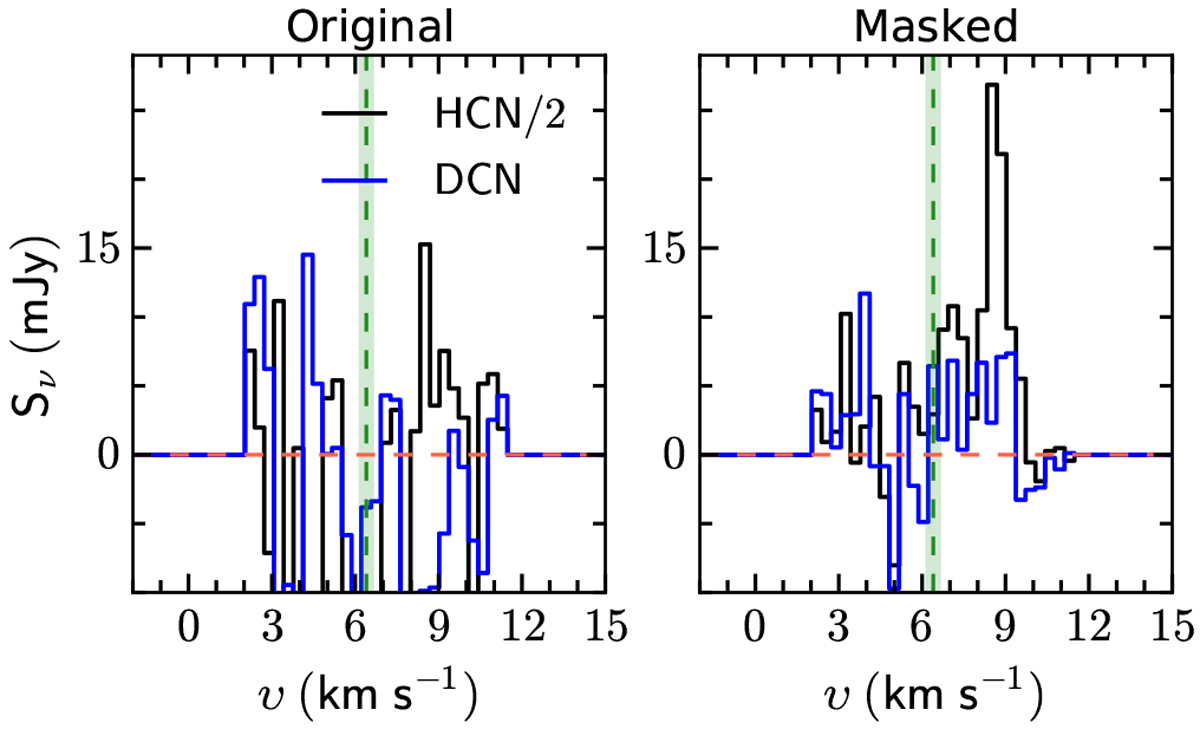
Comparison between the original HCN (black) and DCN (blue) spectra with the masked spectra. The original spectra are the same as Fig. 3. The mask is created from the C18 O channel maps (see text) to highlight the molecular emission associated with the Keplerian disk.
Current usage metrics show cumulative count of Article Views (full-text article views including HTML views, PDF and ePub downloads, according to the available data) and Abstracts Views on Vision4Press platform.
Data correspond to usage on the plateform after 2015. The current usage metrics is available 48-96 hours after online publication and is updated daily on week days.
Initial download of the metrics may take a while.