Free Access
Fig. 7
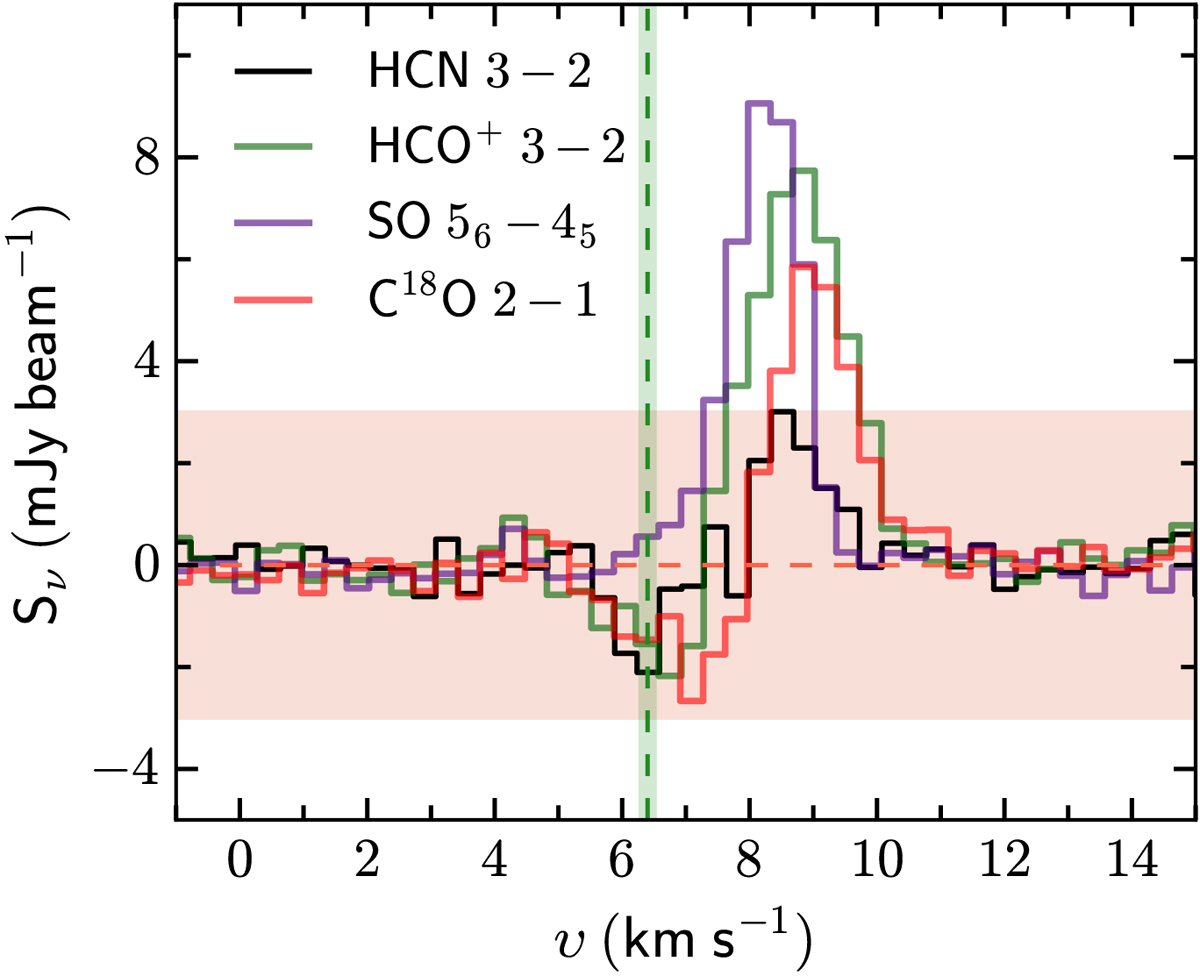
HCN, HCO+, SO, and C18O spectra from the western part of the disk (denoted by the orange rectangle in Fig. 5). The shaded region highlights the − 3 to 3σ levels of the HCN emission, while the red horizontal dashed line shows the baseline, and the green vertical line shows the systemic velocity.
Current usage metrics show cumulative count of Article Views (full-text article views including HTML views, PDF and ePub downloads, according to the available data) and Abstracts Views on Vision4Press platform.
Data correspond to usage on the plateform after 2015. The current usage metrics is available 48-96 hours after online publication and is updated daily on week days.
Initial download of the metrics may take a while.