Free Access
Fig. 3
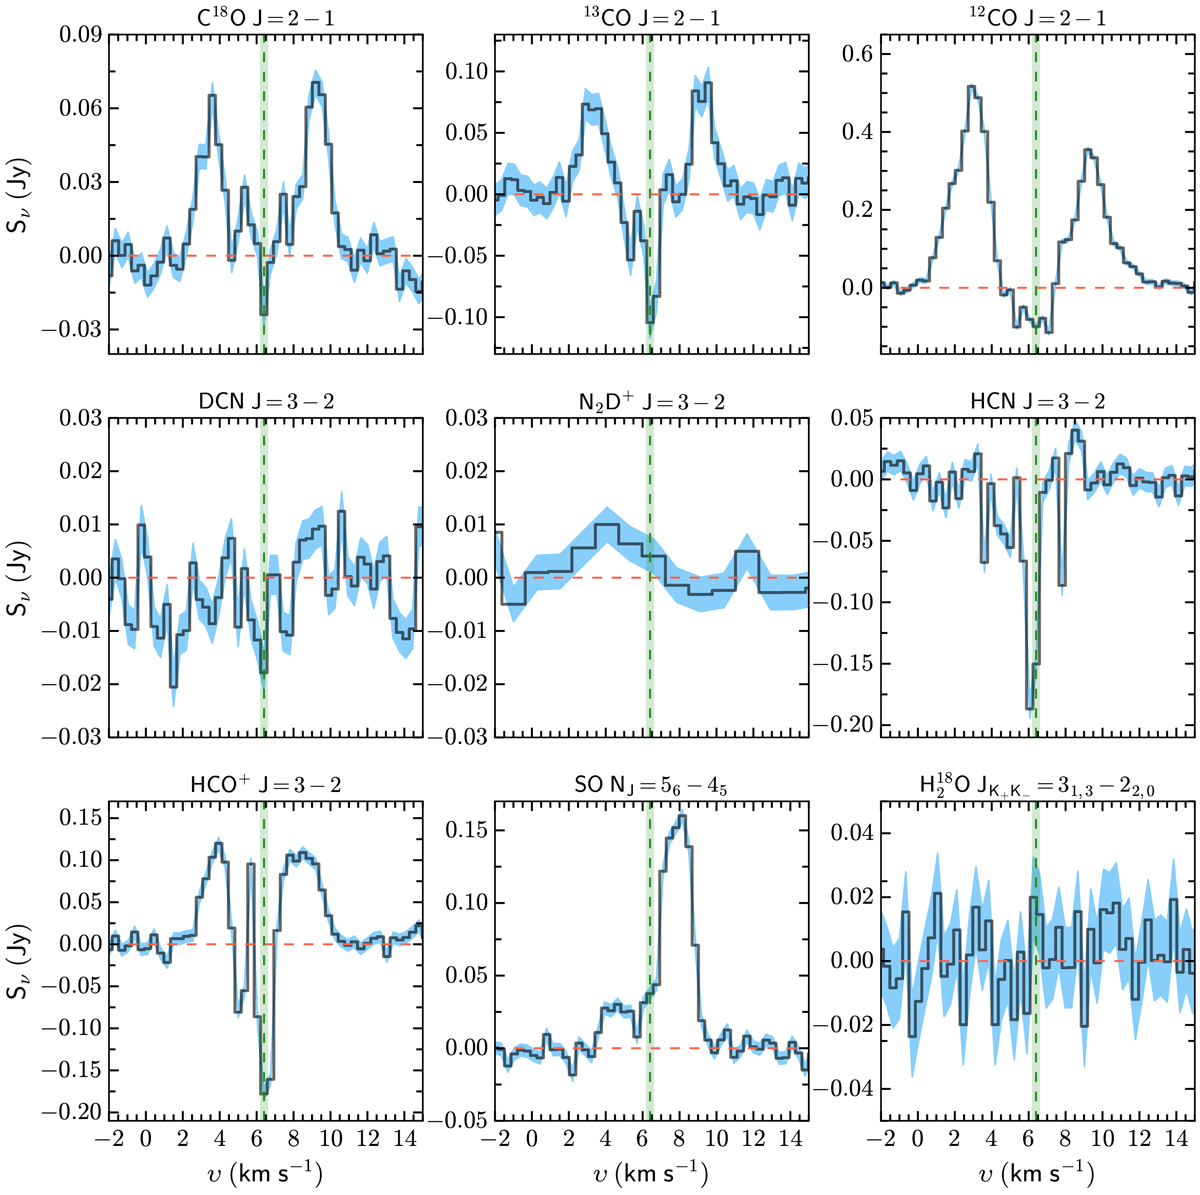
Observed molecular spectra from the inner 1″ square region centered on TMC1A. The green vertical line is the systemic velocity of the system, while the horizontal, red dashed line indicates the baseline. The 1σ error is shown by the shaded blue regions. See Table 2 for more information on each line.
Current usage metrics show cumulative count of Article Views (full-text article views including HTML views, PDF and ePub downloads, according to the available data) and Abstracts Views on Vision4Press platform.
Data correspond to usage on the plateform after 2015. The current usage metrics is available 48-96 hours after online publication and is updated daily on week days.
Initial download of the metrics may take a while.