Free Access
Fig. 8.
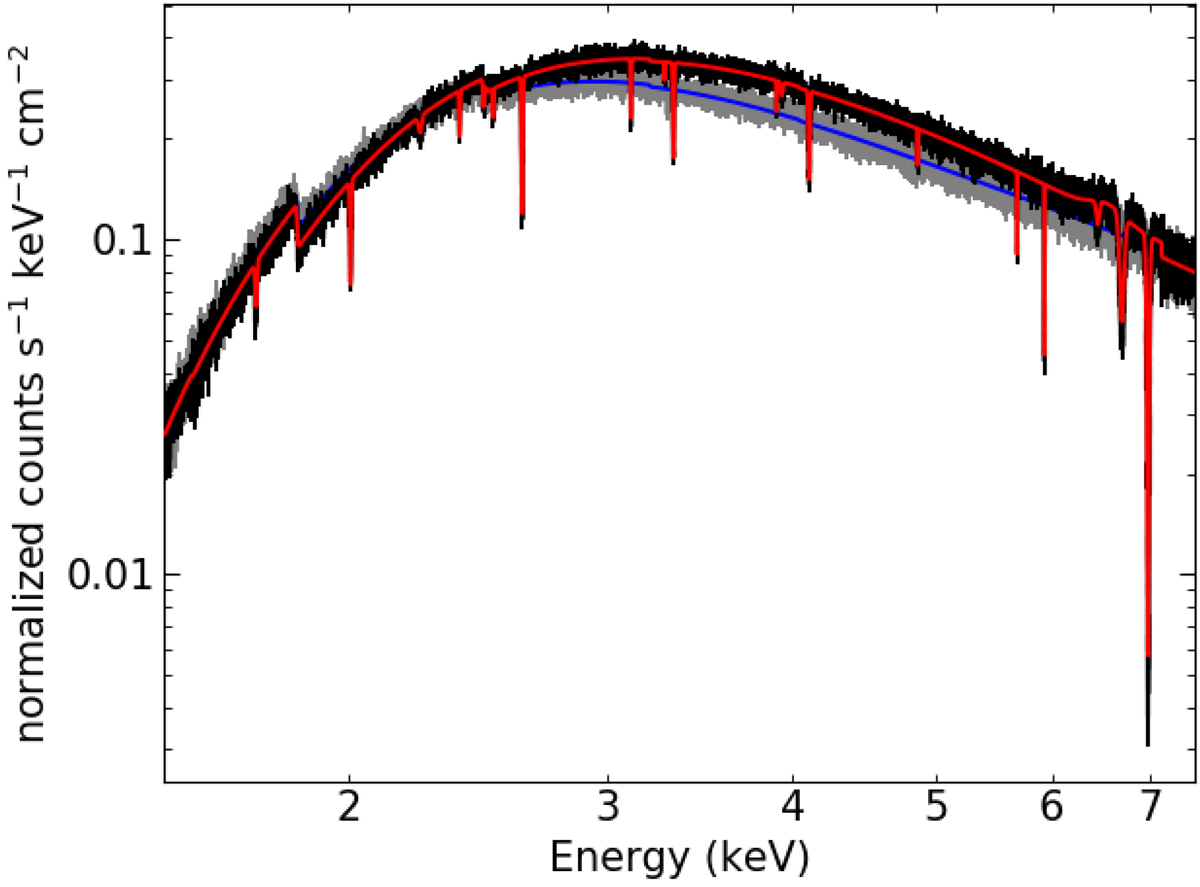
Simulated XRISM spectrum in the same energy band as Chandra HETGS for GRS 1915+105. Here we used the same Chandra HETG best-fit models for the spectra in soft (black) and hard (grey) states. The red and blue lines indicate the fitted phenomenological model.
Current usage metrics show cumulative count of Article Views (full-text article views including HTML views, PDF and ePub downloads, according to the available data) and Abstracts Views on Vision4Press platform.
Data correspond to usage on the plateform after 2015. The current usage metrics is available 48-96 hours after online publication and is updated daily on week days.
Initial download of the metrics may take a while.