Fig. 5
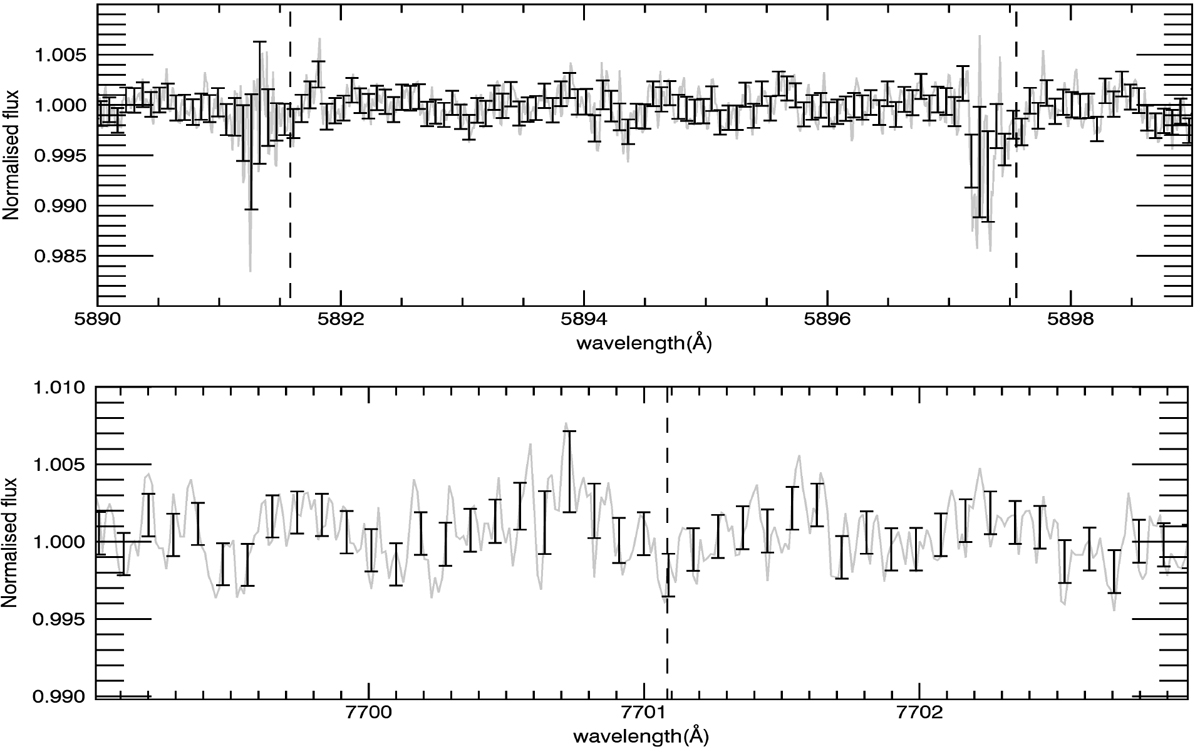
Summary of the observation of WASP-117b with VLT/ESPRESSO. Top: normalised transmission spectrum around the Na D doublet lines. Bottom: normalised transmission spectrum around the K D1 line. The center wavelengths of these absorption lines are indicated as dashed lines. The black data points are spectra binned every seven wavelength points, and the gray lines are original spectra. The stellar line profile change due to the CLV and RM effects is corrected. We display vacuum wavelengths. In normalized flux, planetary Na and K absorption appear as weak depressions around the dashed line.
Current usage metrics show cumulative count of Article Views (full-text article views including HTML views, PDF and ePub downloads, according to the available data) and Abstracts Views on Vision4Press platform.
Data correspond to usage on the plateform after 2015. The current usage metrics is available 48-96 hours after online publication and is updated daily on week days.
Initial download of the metrics may take a while.