Fig. C.1
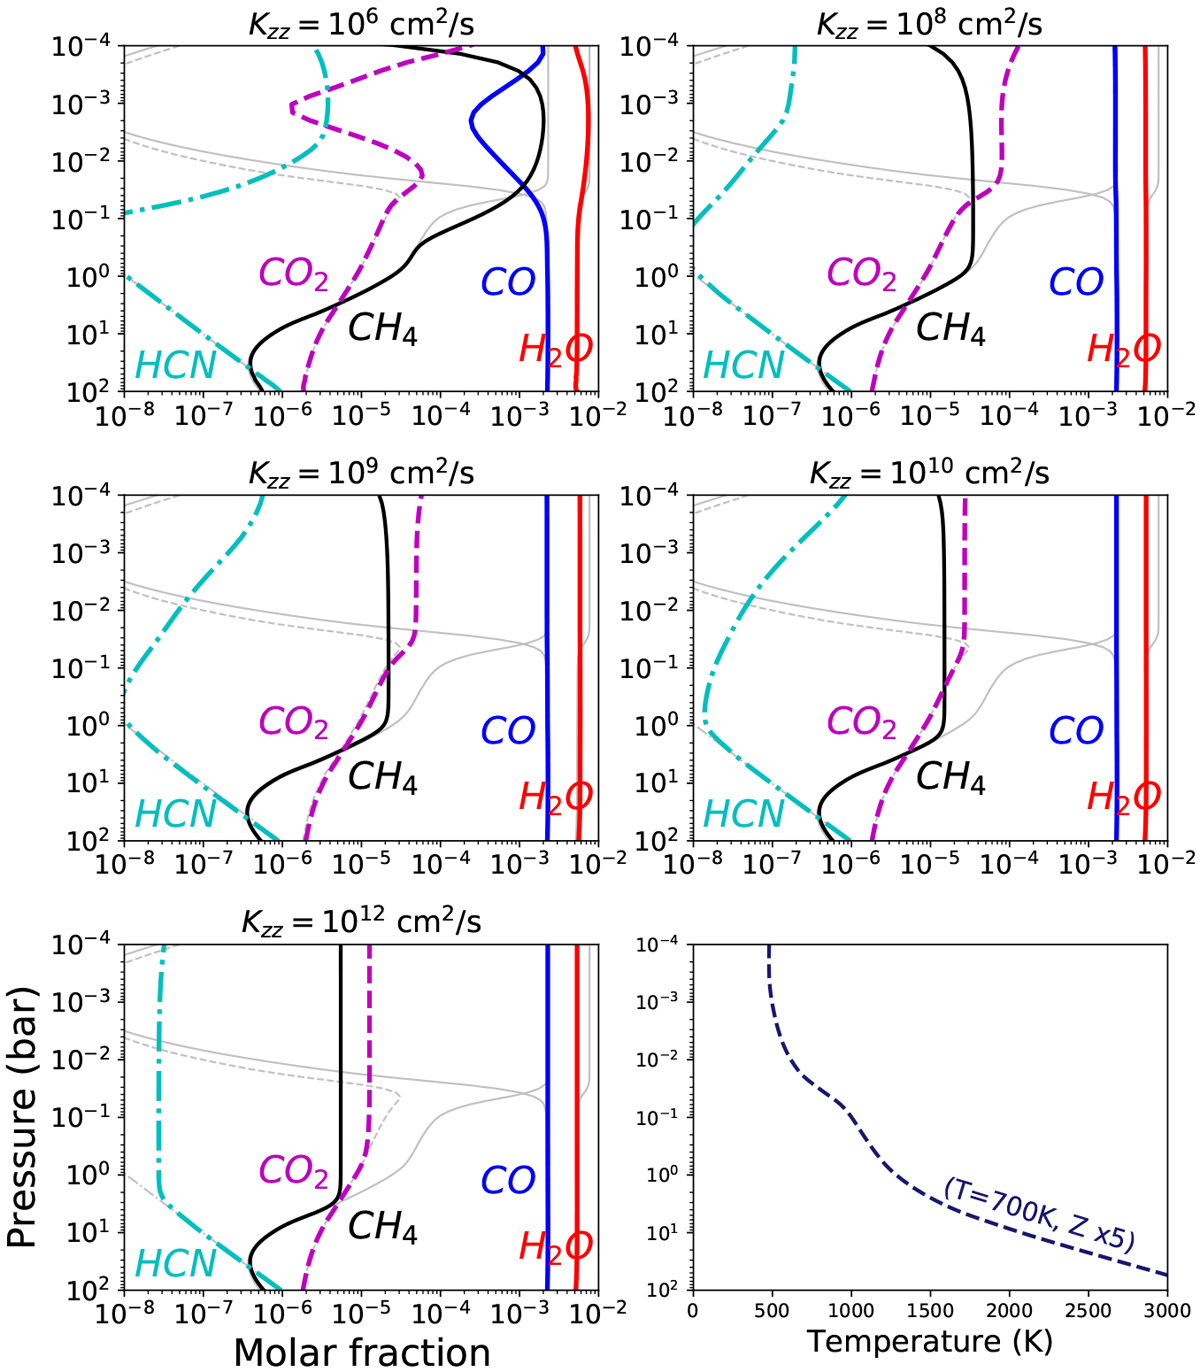
Disequilibrium abundances of the dominant molecules in the atmosphere of WASP-117b computed for different vertical eddycoefficients Kzz with the chemical kinetics code of Venot et al. (2012). The gray lines indicate the chemical equilibrium state. The bottom right plot shows the one-dimensional pressure-temperature profile of WASP-117b, calculated with petitCODE (Mollière et al. 2015, 2017). The model setup is based on the warm, slightly enriched scenario for WASP-117b (Teq =700 K, Z = 5× solar, C/O =0.3).
Current usage metrics show cumulative count of Article Views (full-text article views including HTML views, PDF and ePub downloads, according to the available data) and Abstracts Views on Vision4Press platform.
Data correspond to usage on the plateform after 2015. The current usage metrics is available 48-96 hours after online publication and is updated daily on week days.
Initial download of the metrics may take a while.