Fig. A.1
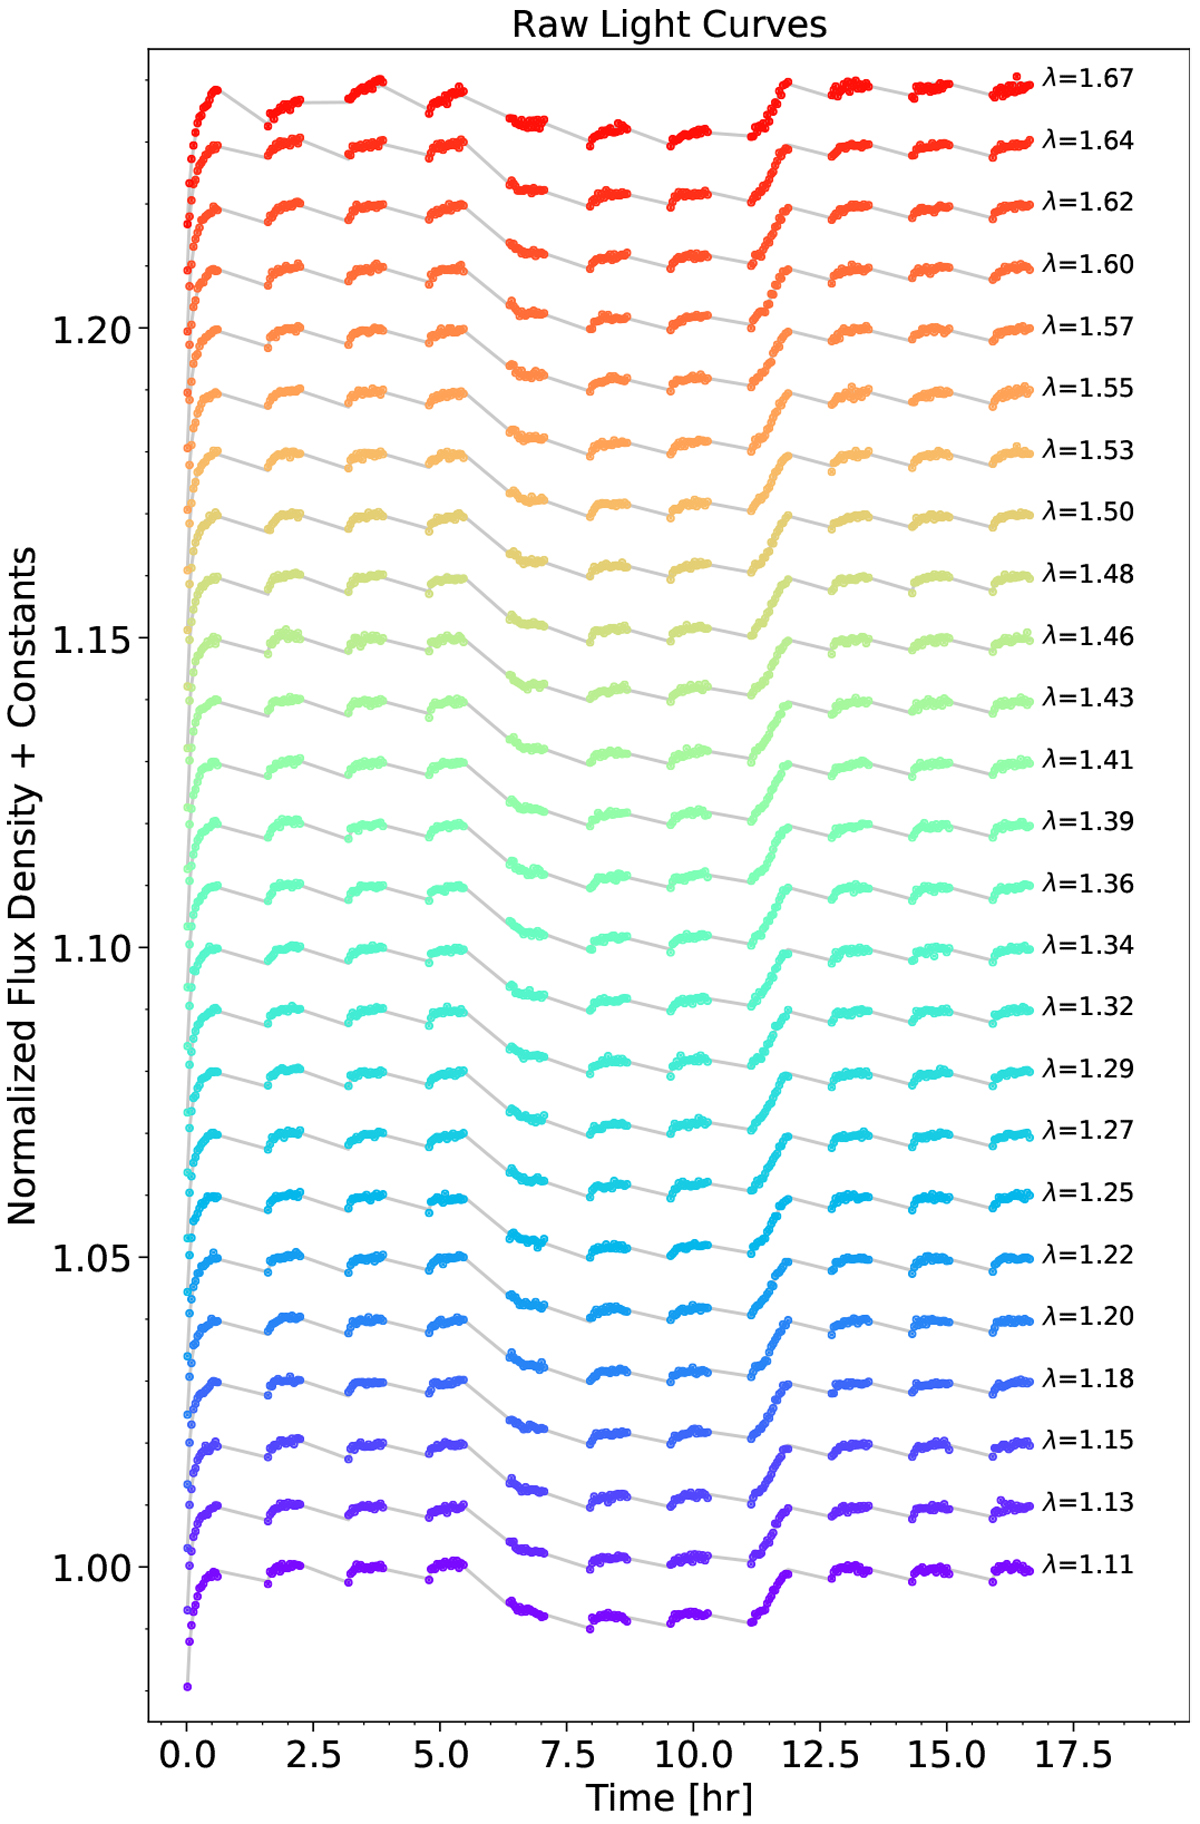
Raw light curves extracted from HST/WFC3 observations of WASP-117b. Each light curve is constructed by the integration of a 5-pixel-wide wavelength bin. Colors of the light curve represent their central wavelengths (using a rainbow color scheme, from red for the longest wavelength (1.67 μm) to blue for the shortest (1.11 μm)). Light-curve systematics are clearly visible, particularly at the first orbit of the observations. The gray curves show the best-fitting RECTE+transit profile models.
Current usage metrics show cumulative count of Article Views (full-text article views including HTML views, PDF and ePub downloads, according to the available data) and Abstracts Views on Vision4Press platform.
Data correspond to usage on the plateform after 2015. The current usage metrics is available 48-96 hours after online publication and is updated daily on week days.
Initial download of the metrics may take a while.