Fig. 4.
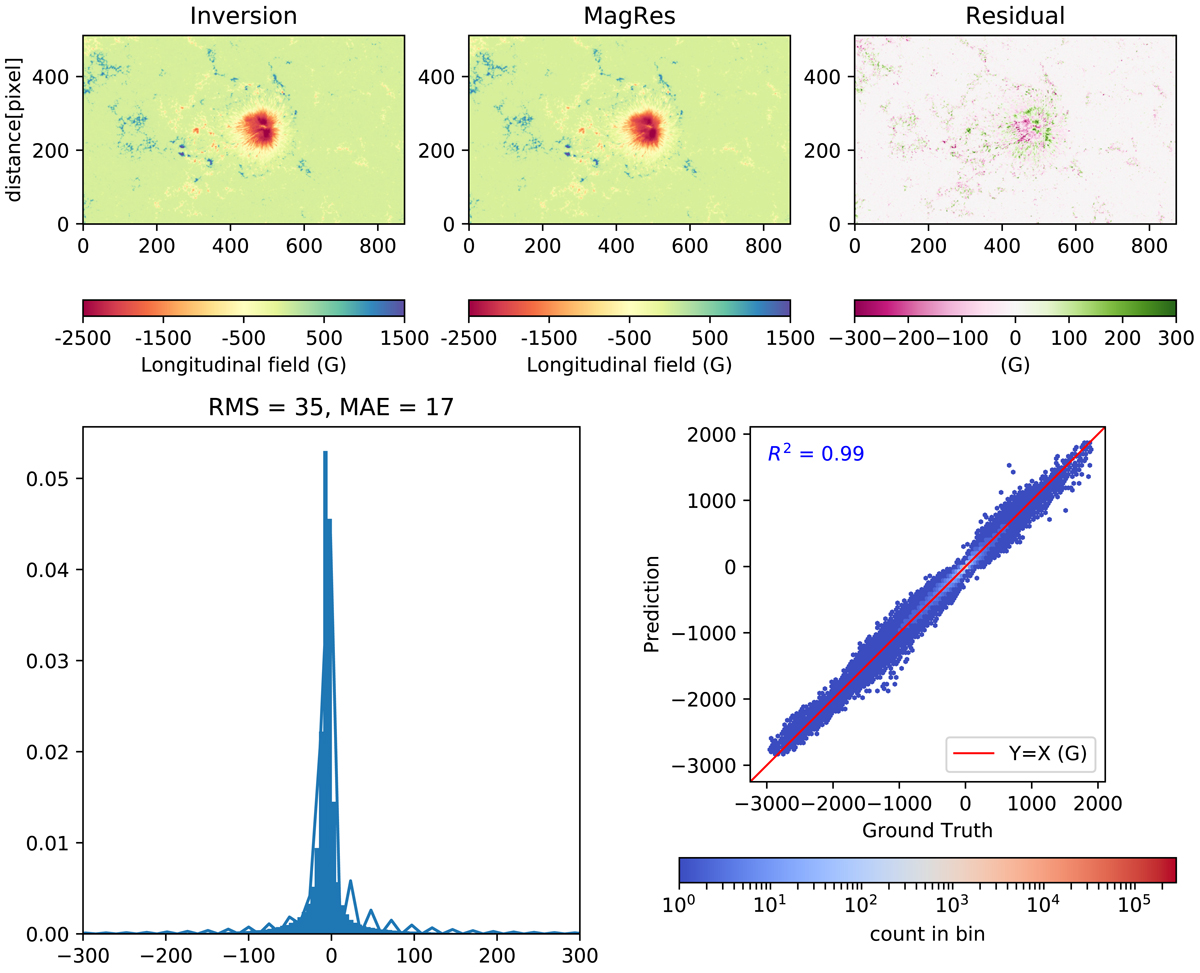
MagRes calibrations for longitudinal magnetic flux density. Upper panels (from left to right): inverted result, MagRes result, and their residual difference, respectively. Lower left panel: histogram of the residual error with its Gaussian kernel density curve. Lower right panel: scatter diagram, which identifies the density of the inversion results with the testing results.
Current usage metrics show cumulative count of Article Views (full-text article views including HTML views, PDF and ePub downloads, according to the available data) and Abstracts Views on Vision4Press platform.
Data correspond to usage on the plateform after 2015. The current usage metrics is available 48-96 hours after online publication and is updated daily on week days.
Initial download of the metrics may take a while.