Free Access
Fig. 6
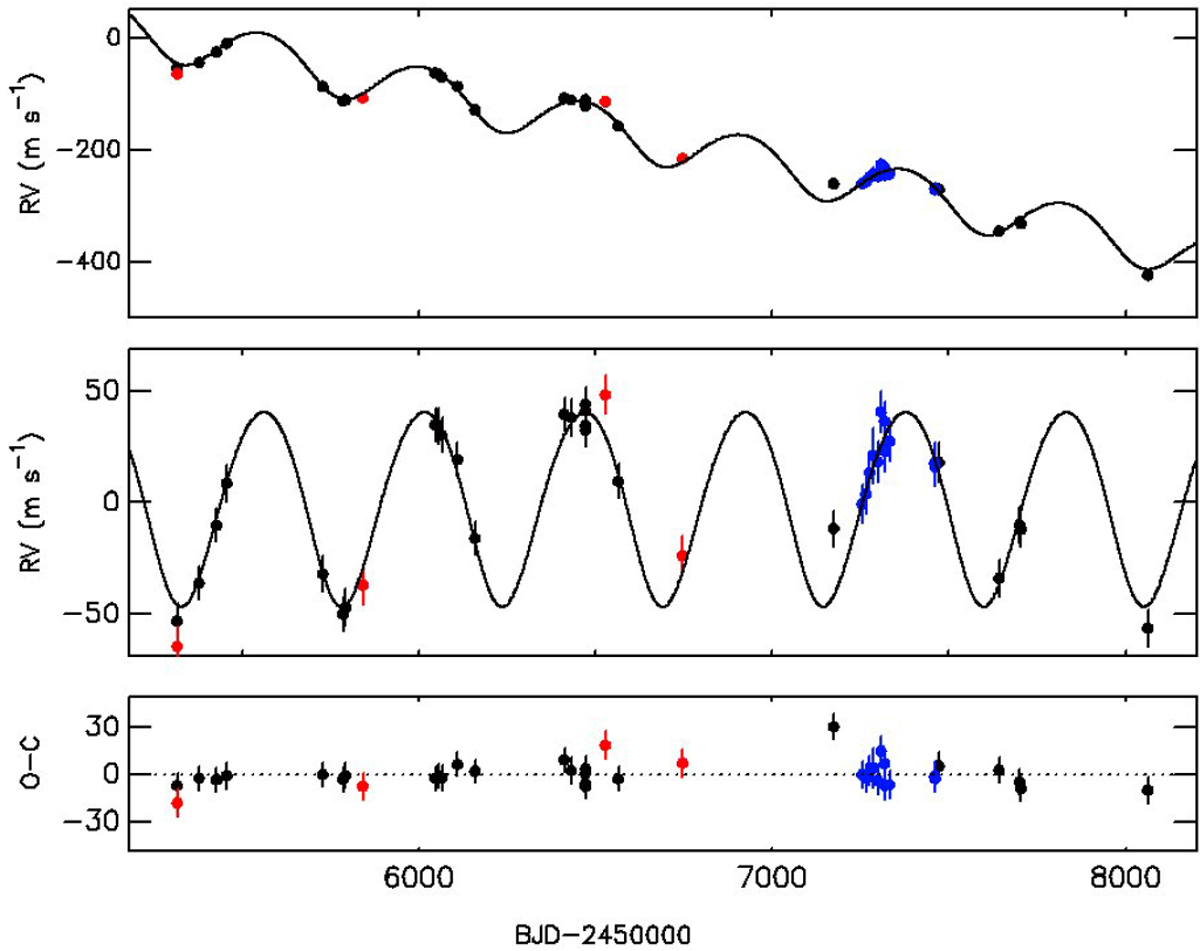
Upper panel: radial velocity variations of HIP 90988. The black, red and blue dots correspond to FEROS, UCLES and CHIRON velocities, respectively. The best Keplerian solution is overplotted (solid black line). Middle panel: RV variations ofHIP 90988 after subtracting a liner trend. Lower panel: post-fit residuals.
Current usage metrics show cumulative count of Article Views (full-text article views including HTML views, PDF and ePub downloads, according to the available data) and Abstracts Views on Vision4Press platform.
Data correspond to usage on the plateform after 2015. The current usage metrics is available 48-96 hours after online publication and is updated daily on week days.
Initial download of the metrics may take a while.