Fig. 1
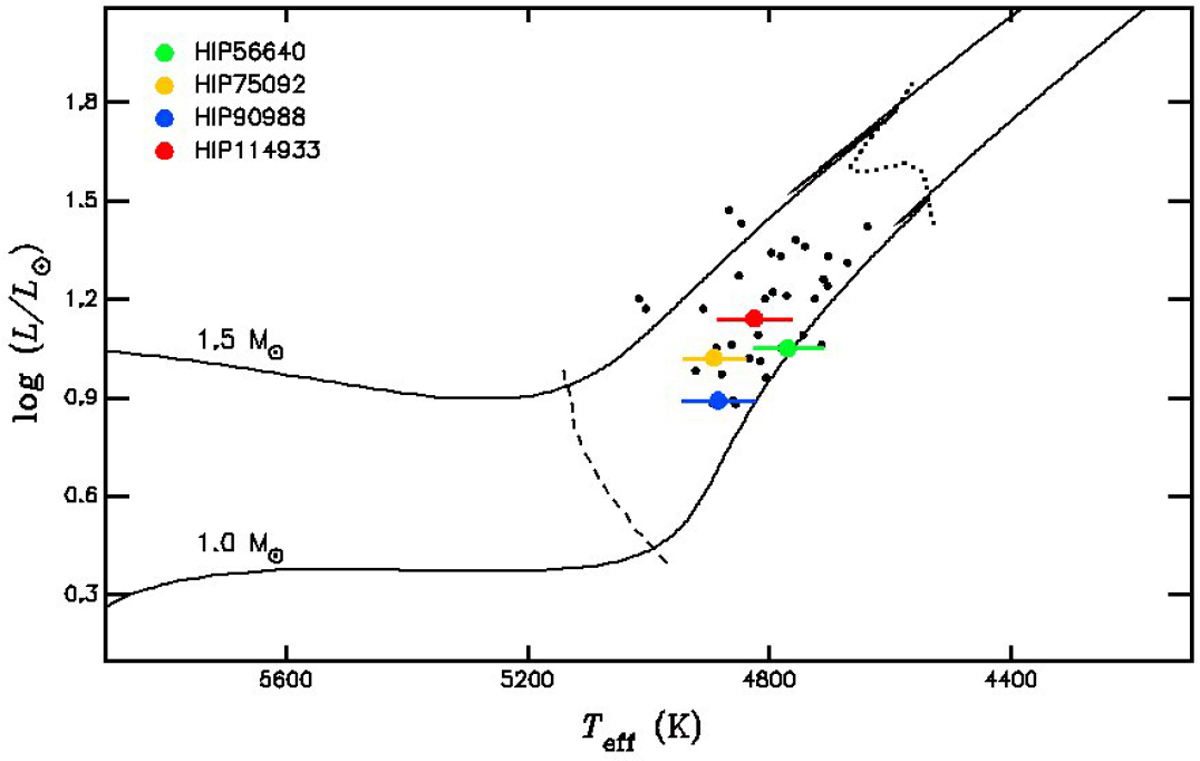
HR diagram showing the position of the four host stars (filled circles). The small black dots represent the 37 targets in common to the EXPRESS and PPPS. The solid lines correspond to 1.0 M⊙ and 1.5 M⊙ PARSEC evolutionary tracks at solar metallicity (Bressan et al. 2012). The dashed line represents the base of the RGB, while the dotted line corresponds to the lower luminosity bump region.
Current usage metrics show cumulative count of Article Views (full-text article views including HTML views, PDF and ePub downloads, according to the available data) and Abstracts Views on Vision4Press platform.
Data correspond to usage on the plateform after 2015. The current usage metrics is available 48-96 hours after online publication and is updated daily on week days.
Initial download of the metrics may take a while.